Guamanian/Chamorro vs Immigrants from Uruguay High School Diploma
COMPARE
Guamanian/Chamorro
Immigrants from Uruguay
High School Diploma
High School Diploma Comparison
Guamanians/Chamorros
Immigrants from Uruguay
88.9%
HIGH SCHOOL DIPLOMA
35.5/ 100
METRIC RATING
187th/ 347
METRIC RANK
87.6%
HIGH SCHOOL DIPLOMA
1.0/ 100
METRIC RATING
253rd/ 347
METRIC RANK
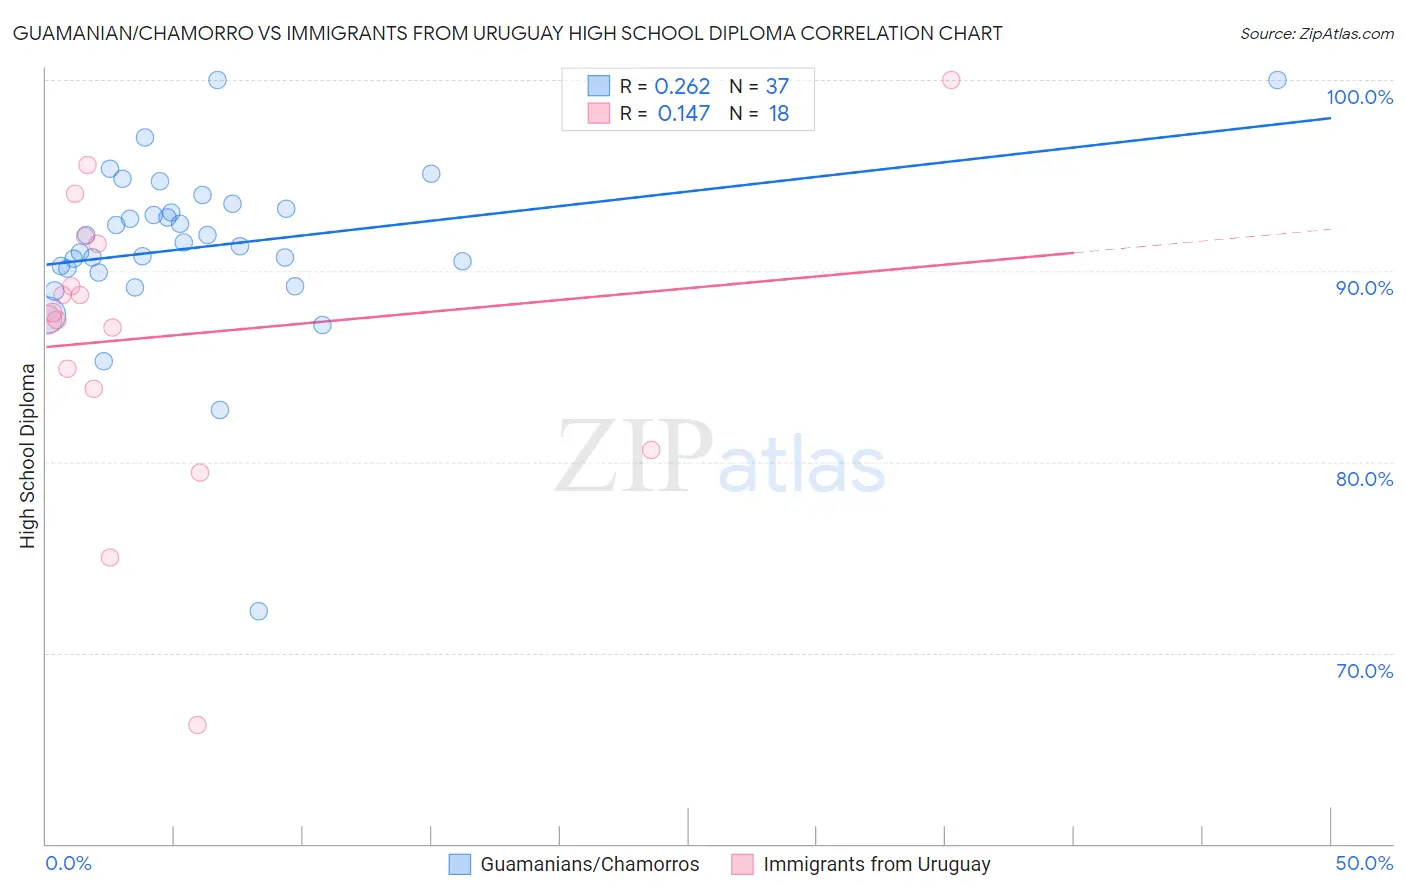
Guamanian/Chamorro vs Immigrants from Uruguay High School Diploma Correlation Chart
The statistical analysis conducted on geographies consisting of 221,965,618 people shows a weak positive correlation between the proportion of Guamanians/Chamorros and percentage of population with at least high school diploma education in the United States with a correlation coefficient (R) of 0.262 and weighted average of 88.9%. Similarly, the statistical analysis conducted on geographies consisting of 133,259,667 people shows a poor positive correlation between the proportion of Immigrants from Uruguay and percentage of population with at least high school diploma education in the United States with a correlation coefficient (R) of 0.147 and weighted average of 87.6%, a difference of 1.5%.
High School Diploma Correlation Summary
| Measurement | Guamanian/Chamorro | Immigrants from Uruguay |
| Minimum | 72.2% | 66.2% |
| Maximum | 100.0% | 100.0% |
| Range | 27.8% | 33.8% |
| Mean | 91.3% | 86.6% |
| Median | 91.5% | 87.6% |
| Interquartile 25% (IQ1) | 90.0% | 83.8% |
| Interquartile 75% (IQ3) | 93.4% | 91.4% |
| Interquartile Range (IQR) | 3.4% | 7.6% |
| Standard Deviation (Sample) | 4.7% | 7.8% |
| Standard Deviation (Population) | 4.6% | 7.6% |
Similar Demographics by High School Diploma
Demographics Similar to Guamanians/Chamorros by High School Diploma
In terms of high school diploma, the demographic groups most similar to Guamanians/Chamorros are Immigrants from Eastern Africa (88.9%, a difference of 0.0%), Ethiopian (89.0%, a difference of 0.020%), Immigrants from Sudan (88.9%, a difference of 0.040%), Immigrants from Uganda (88.9%, a difference of 0.050%), and Immigrants from Syria (89.0%, a difference of 0.060%).
| Demographics | Rating | Rank | High School Diploma |
| Bolivians | 45.2 /100 | #180 | Average 89.1% |
| Venezuelans | 43.6 /100 | #181 | Average 89.1% |
| Spaniards | 43.4 /100 | #182 | Average 89.1% |
| Potawatomi | 42.5 /100 | #183 | Average 89.0% |
| Immigrants | Syria | 39.2 /100 | #184 | Fair 89.0% |
| Ethiopians | 37.0 /100 | #185 | Fair 89.0% |
| Immigrants | Eastern Africa | 35.8 /100 | #186 | Fair 88.9% |
| Guamanians/Chamorros | 35.5 /100 | #187 | Fair 88.9% |
| Immigrants | Sudan | 33.4 /100 | #188 | Fair 88.9% |
| Immigrants | Uganda | 32.6 /100 | #189 | Fair 88.9% |
| Immigrants | Chile | 31.9 /100 | #190 | Fair 88.9% |
| Immigrants | Ethiopia | 30.9 /100 | #191 | Fair 88.9% |
| Moroccans | 29.5 /100 | #192 | Fair 88.8% |
| Immigrants | Oceania | 26.9 /100 | #193 | Fair 88.8% |
| Immigrants | Venezuela | 25.8 /100 | #194 | Fair 88.8% |
Demographics Similar to Immigrants from Uruguay by High School Diploma
In terms of high school diploma, the demographic groups most similar to Immigrants from Uruguay are Immigrants from Colombia (87.6%, a difference of 0.010%), Immigrants from South America (87.6%, a difference of 0.050%), Immigrants from Senegal (87.6%, a difference of 0.060%), Ghanaian (87.7%, a difference of 0.11%), and Senegalese (87.7%, a difference of 0.15%).
| Demographics | Rating | Rank | High School Diploma |
| Immigrants | Eritrea | 1.7 /100 | #246 | Tragic 87.8% |
| Immigrants | Costa Rica | 1.7 /100 | #247 | Tragic 87.8% |
| Spanish Americans | 1.5 /100 | #248 | Tragic 87.7% |
| Senegalese | 1.5 /100 | #249 | Tragic 87.7% |
| Immigrants | Nigeria | 1.5 /100 | #250 | Tragic 87.7% |
| Ghanaians | 1.4 /100 | #251 | Tragic 87.7% |
| Immigrants | South America | 1.2 /100 | #252 | Tragic 87.6% |
| Immigrants | Uruguay | 1.0 /100 | #253 | Tragic 87.6% |
| Immigrants | Colombia | 1.0 /100 | #254 | Tragic 87.6% |
| Immigrants | Senegal | 0.9 /100 | #255 | Tragic 87.6% |
| Africans | 0.7 /100 | #256 | Tragic 87.5% |
| Bahamians | 0.7 /100 | #257 | Tragic 87.5% |
| Immigrants | Ghana | 0.5 /100 | #258 | Tragic 87.4% |
| Immigrants | Western Africa | 0.5 /100 | #259 | Tragic 87.4% |
| Cajuns | 0.4 /100 | #260 | Tragic 87.3% |