Honduran vs Nonimmigrants Unemployment Among Seniors over 65 years
COMPARE
Honduran
Nonimmigrants
Unemployment Among Seniors over 65 years
Unemployment Among Seniors over 65 years Comparison
Hondurans
Nonimmigrants
5.3%
UNEMPLOYMENT AMONG SENIORS OVER 65 YEARS
5.6/ 100
METRIC RATING
225th/ 347
METRIC RANK
5.1%
UNEMPLOYMENT AMONG SENIORS OVER 65 YEARS
54.1/ 100
METRIC RATING
171st/ 347
METRIC RANK
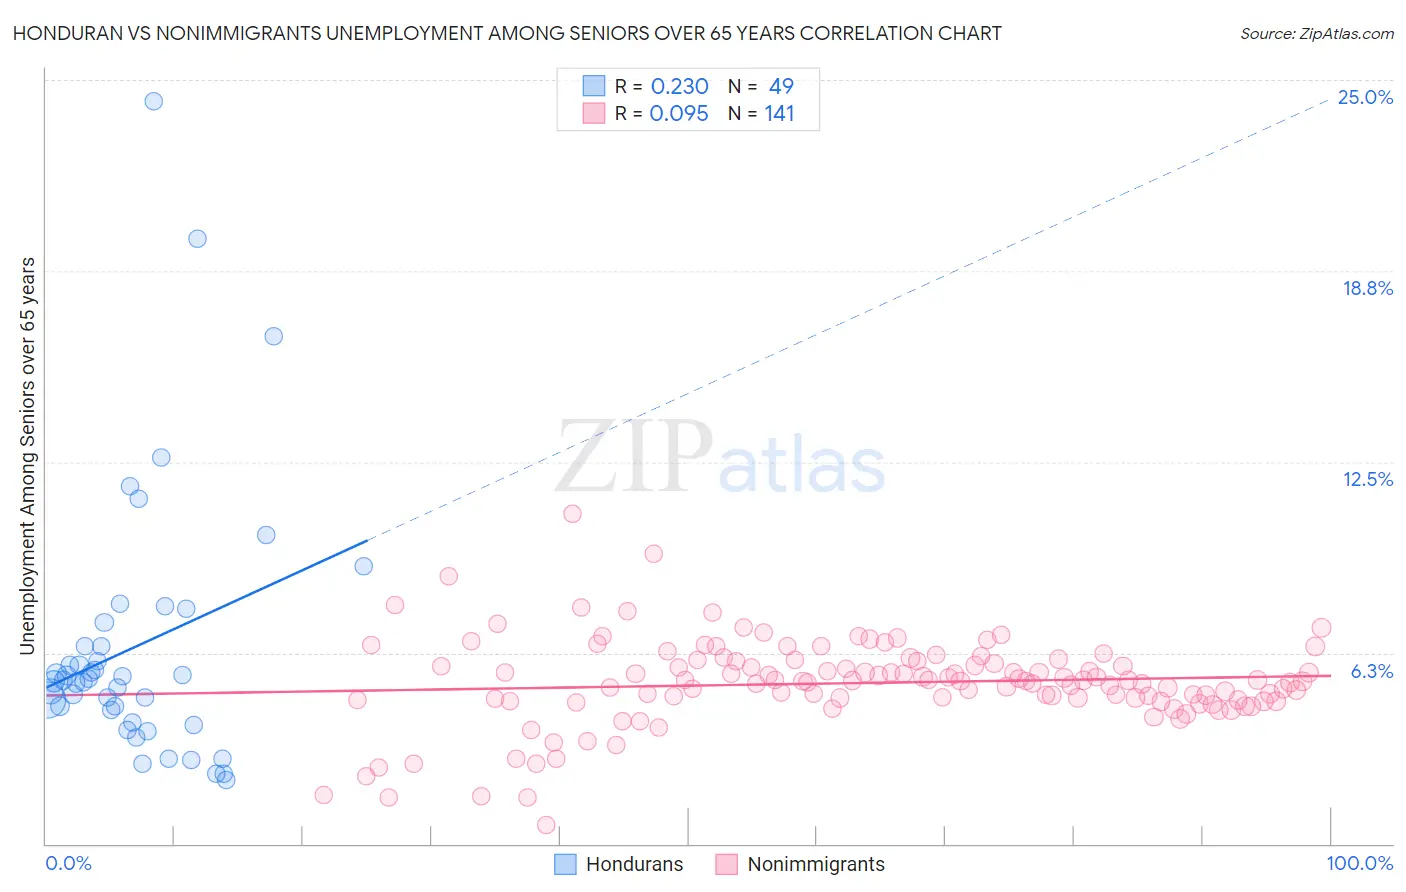
Honduran vs Nonimmigrants Unemployment Among Seniors over 65 years Correlation Chart
The statistical analysis conducted on geographies consisting of 325,799,576 people shows a weak positive correlation between the proportion of Hondurans and unemployment rate amomg seniors over the age of 65 in the United States with a correlation coefficient (R) of 0.230 and weighted average of 5.3%. Similarly, the statistical analysis conducted on geographies consisting of 461,299,977 people shows a slight positive correlation between the proportion of Nonimmigrants and unemployment rate amomg seniors over the age of 65 in the United States with a correlation coefficient (R) of 0.095 and weighted average of 5.1%, a difference of 2.4%.
Unemployment Among Seniors over 65 years Correlation Summary
| Measurement | Honduran | Nonimmigrants |
| Minimum | 2.1% | 0.60% |
| Maximum | 24.3% | 10.8% |
| Range | 22.2% | 10.2% |
| Mean | 6.4% | 5.3% |
| Median | 5.4% | 5.3% |
| Interquartile 25% (IQ1) | 4.2% | 4.7% |
| Interquartile 75% (IQ3) | 6.9% | 6.0% |
| Interquartile Range (IQR) | 2.7% | 1.3% |
| Standard Deviation (Sample) | 4.3% | 1.4% |
| Standard Deviation (Population) | 4.3% | 1.4% |
Similar Demographics by Unemployment Among Seniors over 65 years
Demographics Similar to Hondurans by Unemployment Among Seniors over 65 years
In terms of unemployment among seniors over 65 years, the demographic groups most similar to Hondurans are Immigrants from Syria (5.3%, a difference of 0.010%), Cree (5.3%, a difference of 0.030%), Immigrants from Croatia (5.3%, a difference of 0.050%), French American Indian (5.3%, a difference of 0.060%), and Israeli (5.3%, a difference of 0.090%).
| Demographics | Rating | Rank | Unemployment Among Seniors over 65 years |
| Spaniards | 7.4 /100 | #218 | Tragic 5.2% |
| Dutch West Indians | 6.9 /100 | #219 | Tragic 5.3% |
| Egyptians | 6.4 /100 | #220 | Tragic 5.3% |
| Arapaho | 6.3 /100 | #221 | Tragic 5.3% |
| Israelis | 6.2 /100 | #222 | Tragic 5.3% |
| Cree | 5.8 /100 | #223 | Tragic 5.3% |
| Immigrants | Syria | 5.6 /100 | #224 | Tragic 5.3% |
| Hondurans | 5.6 /100 | #225 | Tragic 5.3% |
| Immigrants | Croatia | 5.3 /100 | #226 | Tragic 5.3% |
| French American Indians | 5.2 /100 | #227 | Tragic 5.3% |
| Haitians | 4.4 /100 | #228 | Tragic 5.3% |
| Samoans | 4.2 /100 | #229 | Tragic 5.3% |
| Immigrants | Argentina | 4.0 /100 | #230 | Tragic 5.3% |
| Hungarians | 3.9 /100 | #231 | Tragic 5.3% |
| Hopi | 3.5 /100 | #232 | Tragic 5.3% |
Demographics Similar to Nonimmigrants by Unemployment Among Seniors over 65 years
In terms of unemployment among seniors over 65 years, the demographic groups most similar to Nonimmigrants are Immigrants from Eastern Asia (5.1%, a difference of 0.020%), Immigrants from Ireland (5.1%, a difference of 0.030%), Immigrants from Spain (5.1%, a difference of 0.080%), Lithuanian (5.1%, a difference of 0.13%), and Spanish American (5.1%, a difference of 0.13%).
| Demographics | Rating | Rank | Unemployment Among Seniors over 65 years |
| Nepalese | 64.5 /100 | #164 | Good 5.1% |
| Immigrants | Ukraine | 64.2 /100 | #165 | Good 5.1% |
| Immigrants | Laos | 63.8 /100 | #166 | Good 5.1% |
| Immigrants | Western Europe | 60.4 /100 | #167 | Good 5.1% |
| Mongolians | 59.8 /100 | #168 | Average 5.1% |
| Lithuanians | 58.2 /100 | #169 | Average 5.1% |
| Immigrants | Eastern Asia | 54.9 /100 | #170 | Average 5.1% |
| Immigrants | Nonimmigrants | 54.1 /100 | #171 | Average 5.1% |
| Immigrants | Ireland | 53.2 /100 | #172 | Average 5.1% |
| Immigrants | Spain | 51.7 /100 | #173 | Average 5.1% |
| Spanish Americans | 50.0 /100 | #174 | Average 5.1% |
| Immigrants | Eastern Europe | 49.8 /100 | #175 | Average 5.1% |
| Indians (Asian) | 46.6 /100 | #176 | Average 5.2% |
| Icelanders | 45.9 /100 | #177 | Average 5.2% |
| Immigrants | Belgium | 44.8 /100 | #178 | Average 5.2% |