Honduran vs Senegalese GED/Equivalency
COMPARE
Honduran
Senegalese
GED/Equivalency
GED/Equivalency Comparison
Hondurans
Senegalese
79.3%
GED/EQUIVALENCY
0.0/ 100
METRIC RATING
325th/ 347
METRIC RANK
84.0%
GED/EQUIVALENCY
1.9/ 100
METRIC RATING
241st/ 347
METRIC RANK
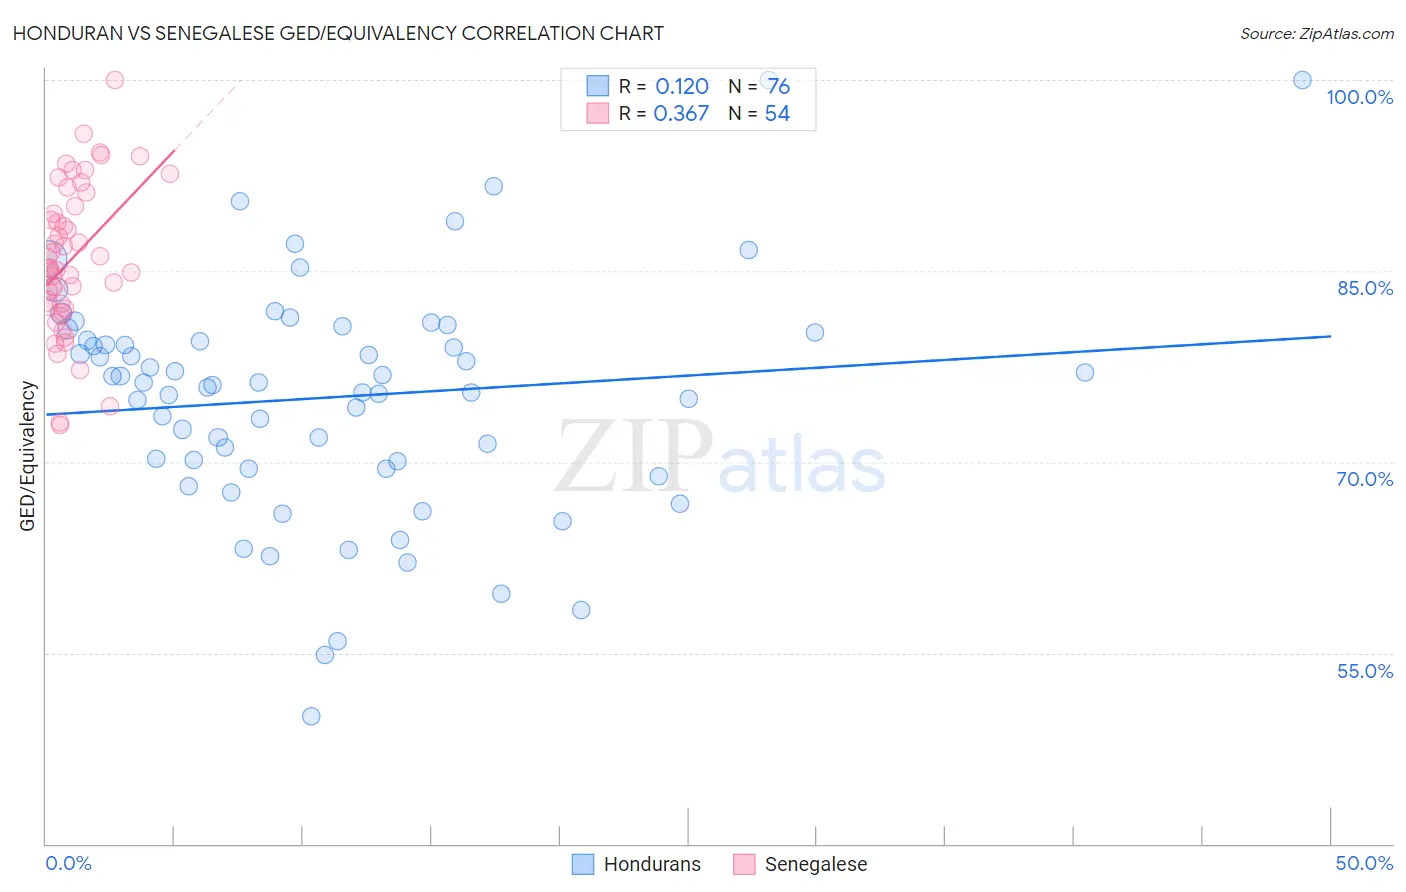
Honduran vs Senegalese GED/Equivalency Correlation Chart
The statistical analysis conducted on geographies consisting of 357,858,578 people shows a poor positive correlation between the proportion of Hondurans and percentage of population with at least ged/equivalency education in the United States with a correlation coefficient (R) of 0.120 and weighted average of 79.3%. Similarly, the statistical analysis conducted on geographies consisting of 78,142,569 people shows a mild positive correlation between the proportion of Senegalese and percentage of population with at least ged/equivalency education in the United States with a correlation coefficient (R) of 0.367 and weighted average of 84.0%, a difference of 6.0%.
GED/Equivalency Correlation Summary
| Measurement | Honduran | Senegalese |
| Minimum | 50.0% | 72.9% |
| Maximum | 100.0% | 100.0% |
| Range | 50.0% | 27.1% |
| Mean | 75.1% | 85.9% |
| Median | 76.2% | 85.2% |
| Interquartile 25% (IQ1) | 69.8% | 82.3% |
| Interquartile 75% (IQ3) | 79.8% | 90.0% |
| Interquartile Range (IQR) | 10.1% | 7.8% |
| Standard Deviation (Sample) | 9.2% | 5.8% |
| Standard Deviation (Population) | 9.1% | 5.8% |
Similar Demographics by GED/Equivalency
Demographics Similar to Hondurans by GED/Equivalency
In terms of ged/equivalency, the demographic groups most similar to Hondurans are Yuman (79.2%, a difference of 0.090%), Central American (79.2%, a difference of 0.11%), Mexican American Indian (79.4%, a difference of 0.12%), Hispanic or Latino (79.1%, a difference of 0.22%), and Dominican (79.1%, a difference of 0.27%).
| Demographics | Rating | Rank | GED/Equivalency |
| Yaqui | 0.0 /100 | #318 | Tragic 80.5% |
| Immigrants | Belize | 0.0 /100 | #319 | Tragic 80.5% |
| Immigrants | Cuba | 0.0 /100 | #320 | Tragic 80.2% |
| Yup'ik | 0.0 /100 | #321 | Tragic 80.0% |
| Lumbee | 0.0 /100 | #322 | Tragic 80.0% |
| Immigrants | Nicaragua | 0.0 /100 | #323 | Tragic 79.9% |
| Mexican American Indians | 0.0 /100 | #324 | Tragic 79.4% |
| Hondurans | 0.0 /100 | #325 | Tragic 79.3% |
| Yuman | 0.0 /100 | #326 | Tragic 79.2% |
| Central Americans | 0.0 /100 | #327 | Tragic 79.2% |
| Hispanics or Latinos | 0.0 /100 | #328 | Tragic 79.1% |
| Dominicans | 0.0 /100 | #329 | Tragic 79.1% |
| Immigrants | Cabo Verde | 0.0 /100 | #330 | Tragic 78.9% |
| Immigrants | Honduras | 0.0 /100 | #331 | Tragic 78.7% |
| Immigrants | Azores | 0.0 /100 | #332 | Tragic 78.7% |
Demographics Similar to Senegalese by GED/Equivalency
In terms of ged/equivalency, the demographic groups most similar to Senegalese are Sri Lankan (84.0%, a difference of 0.020%), Immigrants from South Eastern Asia (84.1%, a difference of 0.14%), Immigrants from Bahamas (84.2%, a difference of 0.15%), Immigrants from Peru (84.2%, a difference of 0.18%), and Cherokee (83.9%, a difference of 0.19%).
| Demographics | Rating | Rank | GED/Equivalency |
| Immigrants | Nigeria | 3.6 /100 | #234 | Tragic 84.3% |
| Ghanaians | 3.5 /100 | #235 | Tragic 84.3% |
| Immigrants | Eritrea | 3.5 /100 | #236 | Tragic 84.3% |
| Sub-Saharan Africans | 3.0 /100 | #237 | Tragic 84.2% |
| Immigrants | Peru | 2.7 /100 | #238 | Tragic 84.2% |
| Immigrants | Bahamas | 2.6 /100 | #239 | Tragic 84.2% |
| Immigrants | South Eastern Asia | 2.5 /100 | #240 | Tragic 84.1% |
| Senegalese | 1.9 /100 | #241 | Tragic 84.0% |
| Sri Lankans | 1.9 /100 | #242 | Tragic 84.0% |
| Cherokee | 1.3 /100 | #243 | Tragic 83.9% |
| Immigrants | Ghana | 1.3 /100 | #244 | Tragic 83.9% |
| Immigrants | Senegal | 1.2 /100 | #245 | Tragic 83.8% |
| Chickasaw | 1.2 /100 | #246 | Tragic 83.8% |
| Immigrants | Western Africa | 1.1 /100 | #247 | Tragic 83.8% |
| Blackfeet | 1.1 /100 | #248 | Tragic 83.8% |