Honduran vs Estonian College, 1 year or more
COMPARE
Honduran
Estonian
College, 1 year or more
College, 1 year or more Comparison
Hondurans
Estonians
51.6%
COLLEGE, 1 YEAR OR MORE
0.0/ 100
METRIC RATING
310th/ 347
METRIC RANK
65.0%
COLLEGE, 1 YEAR OR MORE
99.9/ 100
METRIC RATING
39th/ 347
METRIC RANK
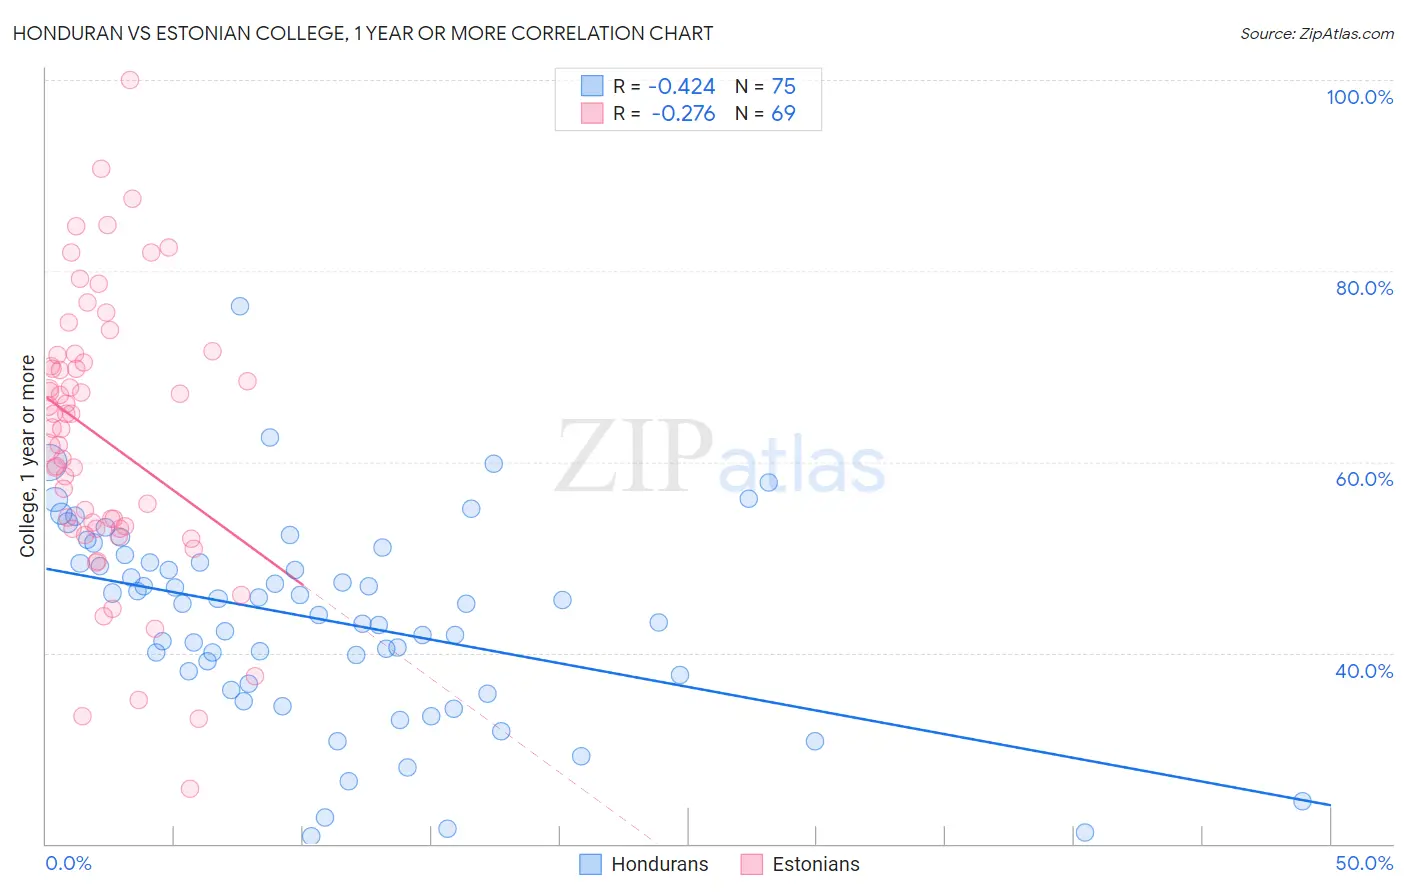
Honduran vs Estonian College, 1 year or more Correlation Chart
The statistical analysis conducted on geographies consisting of 357,855,848 people shows a moderate negative correlation between the proportion of Hondurans and percentage of population with at least college, 1 year or more education in the United States with a correlation coefficient (R) of -0.424 and weighted average of 51.6%. Similarly, the statistical analysis conducted on geographies consisting of 123,528,478 people shows a weak negative correlation between the proportion of Estonians and percentage of population with at least college, 1 year or more education in the United States with a correlation coefficient (R) of -0.276 and weighted average of 65.0%, a difference of 26.0%.
College, 1 year or more Correlation Summary
| Measurement | Honduran | Estonian |
| Minimum | 20.7% | 25.8% |
| Maximum | 76.3% | 100.0% |
| Range | 55.6% | 74.2% |
| Mean | 43.4% | 62.4% |
| Median | 45.1% | 63.5% |
| Interquartile 25% (IQ1) | 36.7% | 53.0% |
| Interquartile 75% (IQ3) | 49.5% | 70.8% |
| Interquartile Range (IQR) | 12.8% | 17.8% |
| Standard Deviation (Sample) | 10.4% | 14.5% |
| Standard Deviation (Population) | 10.4% | 14.4% |
Similar Demographics by College, 1 year or more
Demographics Similar to Hondurans by College, 1 year or more
In terms of college, 1 year or more, the demographic groups most similar to Hondurans are Immigrants from Haiti (51.5%, a difference of 0.16%), Pueblo (51.5%, a difference of 0.20%), Immigrants from Caribbean (51.4%, a difference of 0.33%), Apache (51.8%, a difference of 0.39%), and Salvadoran (51.8%, a difference of 0.40%).
| Demographics | Rating | Rank | College, 1 year or more |
| Creek | 0.0 /100 | #303 | Tragic 52.2% |
| Central Americans | 0.0 /100 | #304 | Tragic 52.1% |
| Seminole | 0.0 /100 | #305 | Tragic 52.1% |
| Mexican American Indians | 0.0 /100 | #306 | Tragic 51.9% |
| Immigrants | Portugal | 0.0 /100 | #307 | Tragic 51.9% |
| Salvadorans | 0.0 /100 | #308 | Tragic 51.8% |
| Apache | 0.0 /100 | #309 | Tragic 51.8% |
| Hondurans | 0.0 /100 | #310 | Tragic 51.6% |
| Immigrants | Haiti | 0.0 /100 | #311 | Tragic 51.5% |
| Pueblo | 0.0 /100 | #312 | Tragic 51.5% |
| Immigrants | Caribbean | 0.0 /100 | #313 | Tragic 51.4% |
| Fijians | 0.0 /100 | #314 | Tragic 51.3% |
| Guatemalans | 0.0 /100 | #315 | Tragic 51.2% |
| Cajuns | 0.0 /100 | #316 | Tragic 51.2% |
| Hispanics or Latinos | 0.0 /100 | #317 | Tragic 51.1% |
Demographics Similar to Estonians by College, 1 year or more
In terms of college, 1 year or more, the demographic groups most similar to Estonians are Immigrants from Kuwait (65.0%, a difference of 0.060%), Immigrants from Saudi Arabia (65.0%, a difference of 0.070%), Russian (65.1%, a difference of 0.22%), Immigrants from South Africa (65.1%, a difference of 0.23%), and Mongolian (64.8%, a difference of 0.26%).
| Demographics | Rating | Rank | College, 1 year or more |
| Bulgarians | 100.0 /100 | #32 | Exceptional 65.5% |
| Immigrants | Sri Lanka | 99.9 /100 | #33 | Exceptional 65.4% |
| Israelis | 99.9 /100 | #34 | Exceptional 65.3% |
| Immigrants | Turkey | 99.9 /100 | #35 | Exceptional 65.2% |
| Immigrants | South Africa | 99.9 /100 | #36 | Exceptional 65.1% |
| Russians | 99.9 /100 | #37 | Exceptional 65.1% |
| Immigrants | Saudi Arabia | 99.9 /100 | #38 | Exceptional 65.0% |
| Estonians | 99.9 /100 | #39 | Exceptional 65.0% |
| Immigrants | Kuwait | 99.9 /100 | #40 | Exceptional 65.0% |
| Mongolians | 99.9 /100 | #41 | Exceptional 64.8% |
| Immigrants | Latvia | 99.9 /100 | #42 | Exceptional 64.8% |
| Immigrants | Russia | 99.9 /100 | #43 | Exceptional 64.7% |
| Immigrants | Norway | 99.9 /100 | #44 | Exceptional 64.7% |
| Immigrants | Lithuania | 99.9 /100 | #45 | Exceptional 64.6% |
| Bhutanese | 99.9 /100 | #46 | Exceptional 64.6% |