Hmong vs Immigrants from Kuwait Single Father Poverty
COMPARE
Hmong
Immigrants from Kuwait
Single Father Poverty
Single Father Poverty Comparison
Hmong
Immigrants from Kuwait
15.9%
SINGLE FATHER POVERTY
91.1/ 100
METRIC RATING
126th/ 347
METRIC RANK
16.0%
SINGLE FATHER POVERTY
81.4/ 100
METRIC RATING
144th/ 347
METRIC RANK
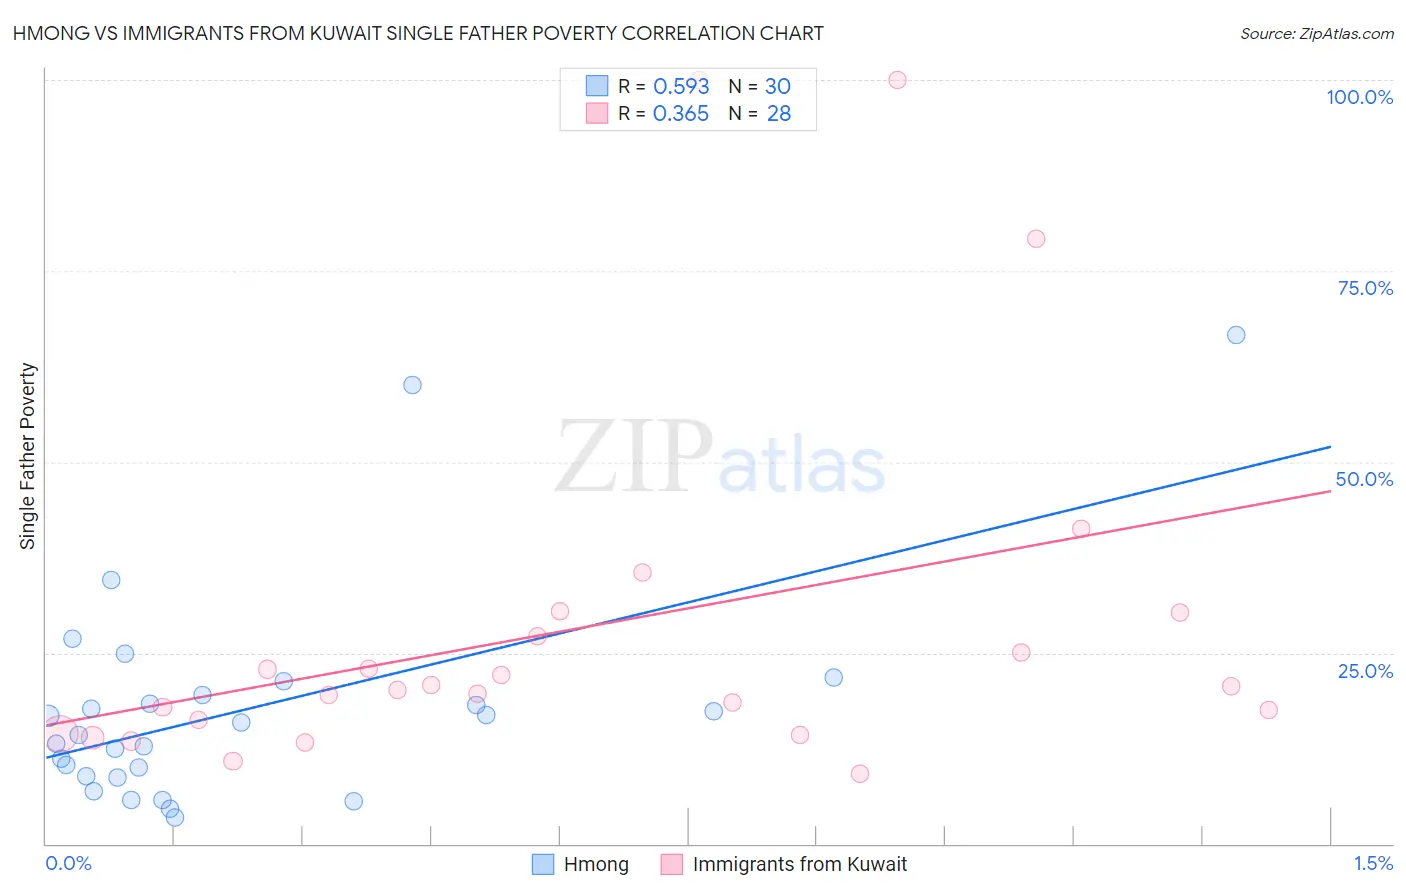
Hmong vs Immigrants from Kuwait Single Father Poverty Correlation Chart
The statistical analysis conducted on geographies consisting of 23,884,581 people shows a substantial positive correlation between the proportion of Hmong and poverty level among single fathers in the United States with a correlation coefficient (R) of 0.593 and weighted average of 15.9%. Similarly, the statistical analysis conducted on geographies consisting of 120,904,433 people shows a mild positive correlation between the proportion of Immigrants from Kuwait and poverty level among single fathers in the United States with a correlation coefficient (R) of 0.365 and weighted average of 16.0%, a difference of 0.96%.
Single Father Poverty Correlation Summary
| Measurement | Hmong | Immigrants from Kuwait |
| Minimum | 3.4% | 9.1% |
| Maximum | 66.7% | 100.0% |
| Range | 63.3% | 90.9% |
| Mean | 17.7% | 28.5% |
| Median | 15.0% | 20.4% |
| Interquartile 25% (IQ1) | 8.8% | 15.3% |
| Interquartile 75% (IQ3) | 19.4% | 28.8% |
| Interquartile Range (IQR) | 10.6% | 13.4% |
| Standard Deviation (Sample) | 14.4% | 24.1% |
| Standard Deviation (Population) | 14.1% | 23.7% |
Demographics Similar to Hmong and Immigrants from Kuwait by Single Father Poverty
In terms of single father poverty, the demographic groups most similar to Hmong are Iraqi (15.9%, a difference of 0.010%), Immigrants from Liberia (15.9%, a difference of 0.010%), Immigrants from Nigeria (15.9%, a difference of 0.040%), Immigrants from West Indies (15.9%, a difference of 0.050%), and Norwegian (15.9%, a difference of 0.13%). Similarly, the demographic groups most similar to Immigrants from Kuwait are Immigrants from Western Asia (16.0%, a difference of 0.050%), Immigrants from Central America (16.0%, a difference of 0.13%), Liberian (16.0%, a difference of 0.15%), Immigrants from Mexico (16.0%, a difference of 0.15%), and Immigrants from Netherlands (16.0%, a difference of 0.32%).
| Demographics | Rating | Rank | Single Father Poverty |
| Iraqis | 91.2 /100 | #125 | Exceptional 15.9% |
| Hmong | 91.1 /100 | #126 | Exceptional 15.9% |
| Immigrants | Liberia | 91.1 /100 | #127 | Exceptional 15.9% |
| Immigrants | Nigeria | 90.8 /100 | #128 | Exceptional 15.9% |
| Immigrants | West Indies | 90.8 /100 | #129 | Exceptional 15.9% |
| Norwegians | 90.2 /100 | #130 | Exceptional 15.9% |
| Nicaraguans | 90.1 /100 | #131 | Exceptional 15.9% |
| Immigrants | Portugal | 89.7 /100 | #132 | Excellent 15.9% |
| Immigrants | Syria | 89.5 /100 | #133 | Excellent 15.9% |
| Immigrants | South America | 88.5 /100 | #134 | Excellent 15.9% |
| Immigrants | Sri Lanka | 88.2 /100 | #135 | Excellent 15.9% |
| Cypriots | 87.5 /100 | #136 | Excellent 15.9% |
| Immigrants | Azores | 87.2 /100 | #137 | Excellent 15.9% |
| Central Americans | 87.1 /100 | #138 | Excellent 16.0% |
| South Americans | 85.9 /100 | #139 | Excellent 16.0% |
| Immigrants | Netherlands | 85.3 /100 | #140 | Excellent 16.0% |
| Liberians | 83.3 /100 | #141 | Excellent 16.0% |
| Immigrants | Mexico | 83.3 /100 | #142 | Excellent 16.0% |
| Immigrants | Central America | 83.1 /100 | #143 | Excellent 16.0% |
| Immigrants | Kuwait | 81.4 /100 | #144 | Excellent 16.0% |
| Immigrants | Western Asia | 80.7 /100 | #145 | Excellent 16.0% |