Hmong vs Immigrants from Kuwait Doctorate Degree
COMPARE
Hmong
Immigrants from Kuwait
Doctorate Degree
Doctorate Degree Comparison
Hmong
Immigrants from Kuwait
1.6%
DOCTORATE DEGREE
1.8/ 100
METRIC RATING
246th/ 347
METRIC RANK
2.6%
DOCTORATE DEGREE
100.0/ 100
METRIC RATING
37th/ 347
METRIC RANK
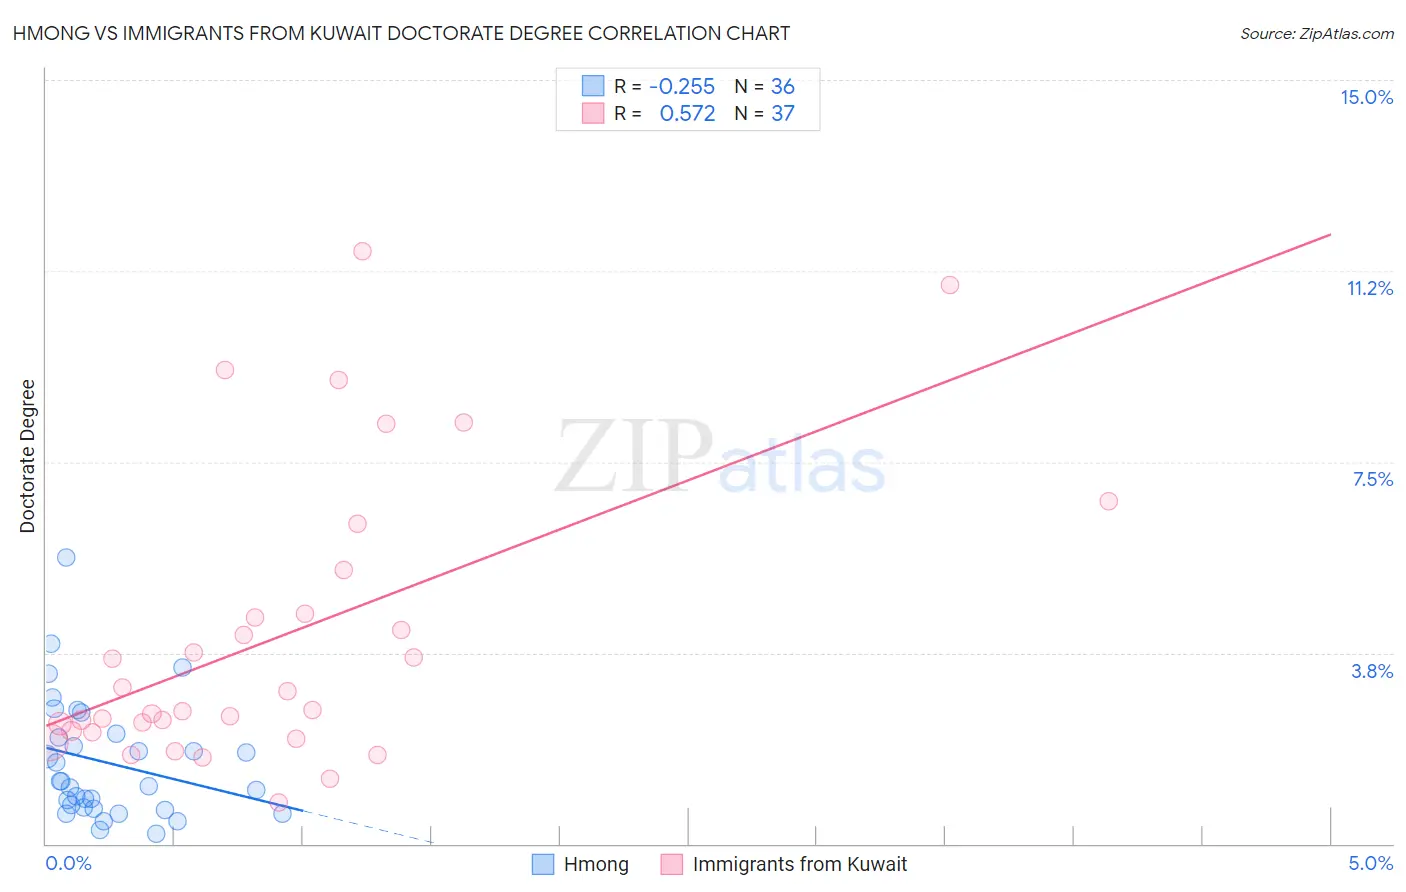
Hmong vs Immigrants from Kuwait Doctorate Degree Correlation Chart
The statistical analysis conducted on geographies consisting of 24,653,481 people shows a weak negative correlation between the proportion of Hmong and percentage of population with at least doctorate degree education in the United States with a correlation coefficient (R) of -0.255 and weighted average of 1.6%. Similarly, the statistical analysis conducted on geographies consisting of 136,719,755 people shows a substantial positive correlation between the proportion of Immigrants from Kuwait and percentage of population with at least doctorate degree education in the United States with a correlation coefficient (R) of 0.572 and weighted average of 2.6%, a difference of 62.7%.
Doctorate Degree Correlation Summary
| Measurement | Hmong | Immigrants from Kuwait |
| Minimum | 0.21% | 0.82% |
| Maximum | 5.6% | 11.6% |
| Range | 5.4% | 10.8% |
| Mean | 1.6% | 4.1% |
| Median | 1.2% | 2.6% |
| Interquartile 25% (IQ1) | 0.69% | 2.2% |
| Interquartile 75% (IQ3) | 2.1% | 4.9% |
| Interquartile Range (IQR) | 1.4% | 2.7% |
| Standard Deviation (Sample) | 1.2% | 2.8% |
| Standard Deviation (Population) | 1.2% | 2.8% |
Similar Demographics by Doctorate Degree
Demographics Similar to Hmong by Doctorate Degree
In terms of doctorate degree, the demographic groups most similar to Hmong are Comanche (1.6%, a difference of 0.020%), Delaware (1.6%, a difference of 0.10%), African (1.6%, a difference of 0.14%), French American Indian (1.6%, a difference of 0.47%), and Potawatomi (1.6%, a difference of 0.61%).
| Demographics | Rating | Rank | Doctorate Degree |
| West Indians | 2.5 /100 | #239 | Tragic 1.6% |
| Immigrants | Panama | 2.4 /100 | #240 | Tragic 1.6% |
| Cheyenne | 2.3 /100 | #241 | Tragic 1.6% |
| Ottawa | 2.2 /100 | #242 | Tragic 1.6% |
| Native Hawaiians | 2.1 /100 | #243 | Tragic 1.6% |
| French American Indians | 2.0 /100 | #244 | Tragic 1.6% |
| Delaware | 1.9 /100 | #245 | Tragic 1.6% |
| Hmong | 1.8 /100 | #246 | Tragic 1.6% |
| Comanche | 1.8 /100 | #247 | Tragic 1.6% |
| Africans | 1.8 /100 | #248 | Tragic 1.6% |
| Potawatomi | 1.6 /100 | #249 | Tragic 1.6% |
| Immigrants | Fiji | 1.6 /100 | #250 | Tragic 1.6% |
| Apache | 1.3 /100 | #251 | Tragic 1.5% |
| Yuman | 1.1 /100 | #252 | Tragic 1.5% |
| Americans | 1.0 /100 | #253 | Tragic 1.5% |
Demographics Similar to Immigrants from Kuwait by Doctorate Degree
In terms of doctorate degree, the demographic groups most similar to Immigrants from Kuwait are Russian (2.6%, a difference of 0.15%), Immigrants from Spain (2.6%, a difference of 0.26%), Immigrants from Malaysia (2.6%, a difference of 0.32%), Cypriot (2.6%, a difference of 0.38%), and Cambodian (2.6%, a difference of 0.50%).
| Demographics | Rating | Rank | Doctorate Degree |
| Immigrants | Korea | 100.0 /100 | #30 | Exceptional 2.6% |
| Latvians | 100.0 /100 | #31 | Exceptional 2.6% |
| Immigrants | Northern Europe | 100.0 /100 | #32 | Exceptional 2.6% |
| Cambodians | 100.0 /100 | #33 | Exceptional 2.6% |
| Cypriots | 100.0 /100 | #34 | Exceptional 2.6% |
| Immigrants | Malaysia | 100.0 /100 | #35 | Exceptional 2.6% |
| Immigrants | Spain | 100.0 /100 | #36 | Exceptional 2.6% |
| Immigrants | Kuwait | 100.0 /100 | #37 | Exceptional 2.6% |
| Russians | 100.0 /100 | #38 | Exceptional 2.6% |
| Immigrants | Ireland | 100.0 /100 | #39 | Exceptional 2.5% |
| Estonians | 100.0 /100 | #40 | Exceptional 2.5% |
| Immigrants | Russia | 100.0 /100 | #41 | Exceptional 2.5% |
| New Zealanders | 100.0 /100 | #42 | Exceptional 2.5% |
| Soviet Union | 100.0 /100 | #43 | Exceptional 2.5% |
| Immigrants | Netherlands | 100.0 /100 | #44 | Exceptional 2.5% |