Hmong vs British 10th Grade
COMPARE
Hmong
British
10th Grade
10th Grade Comparison
Hmong
British
94.1%
10TH GRADE
86.6/ 100
METRIC RATING
141st/ 347
METRIC RANK
95.3%
10TH GRADE
99.9/ 100
METRIC RATING
34th/ 347
METRIC RANK
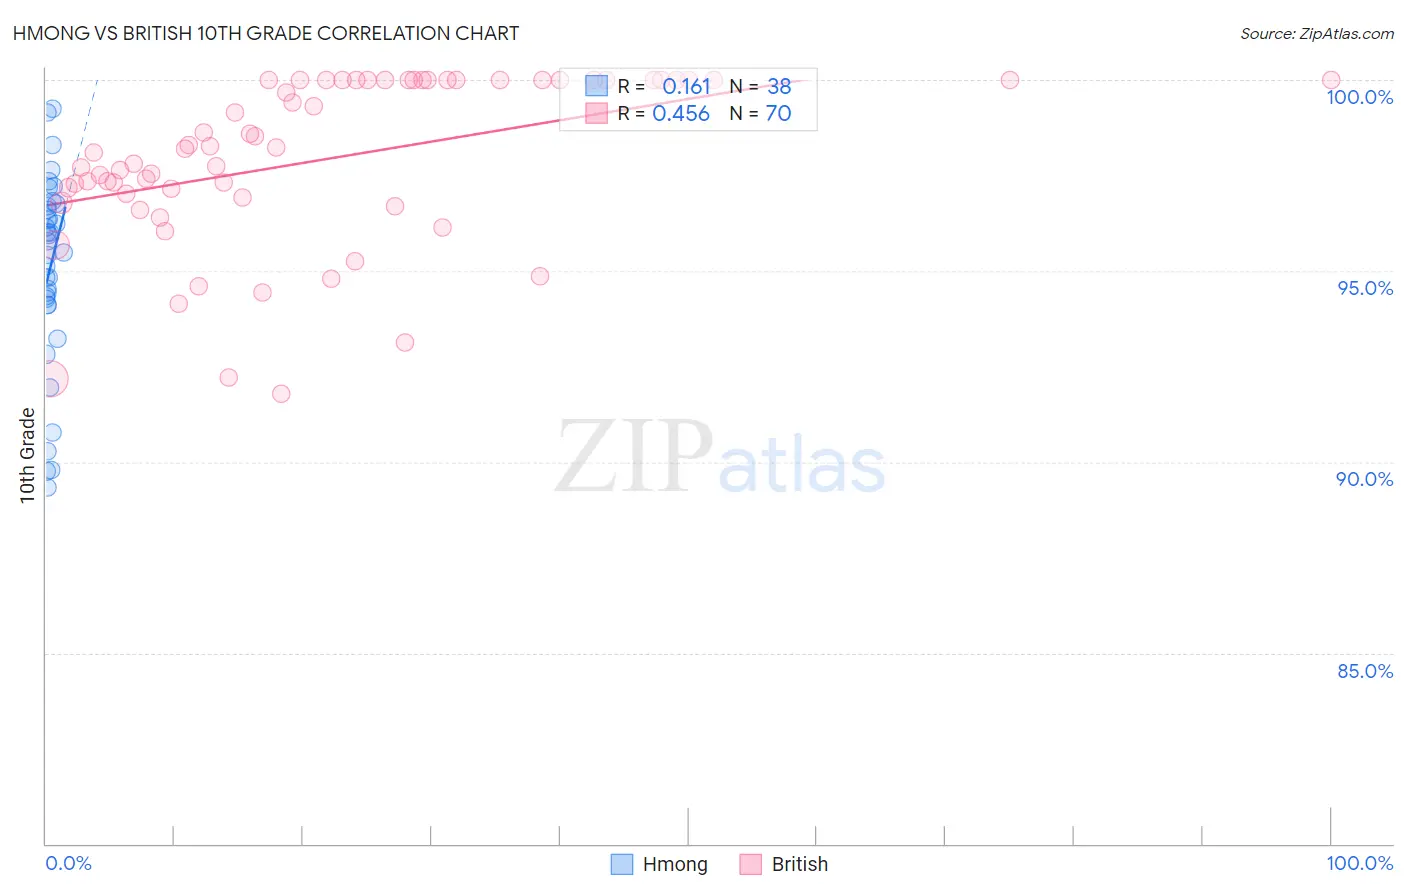
Hmong vs British 10th Grade Correlation Chart
The statistical analysis conducted on geographies consisting of 24,672,093 people shows a poor positive correlation between the proportion of Hmong and percentage of population with at least 10th grade education in the United States with a correlation coefficient (R) of 0.161 and weighted average of 94.1%. Similarly, the statistical analysis conducted on geographies consisting of 531,463,601 people shows a moderate positive correlation between the proportion of British and percentage of population with at least 10th grade education in the United States with a correlation coefficient (R) of 0.456 and weighted average of 95.3%, a difference of 1.3%.
10th Grade Correlation Summary
| Measurement | Hmong | British |
| Minimum | 89.3% | 91.8% |
| Maximum | 99.2% | 100.0% |
| Range | 9.9% | 8.2% |
| Mean | 95.0% | 97.9% |
| Median | 95.6% | 98.2% |
| Interquartile 25% (IQ1) | 94.1% | 96.9% |
| Interquartile 75% (IQ3) | 96.7% | 100.0% |
| Interquartile Range (IQR) | 2.6% | 3.1% |
| Standard Deviation (Sample) | 2.5% | 2.2% |
| Standard Deviation (Population) | 2.5% | 2.2% |
Similar Demographics by 10th Grade
Demographics Similar to Hmong by 10th Grade
In terms of 10th grade, the demographic groups most similar to Hmong are Albanian (94.1%, a difference of 0.0%), Immigrants from Jordan (94.1%, a difference of 0.020%), Cherokee (94.1%, a difference of 0.030%), Immigrants from Kazakhstan (94.1%, a difference of 0.030%), and Nonimmigrants (94.1%, a difference of 0.050%).
| Demographics | Rating | Rank | 10th Grade |
| Osage | 91.7 /100 | #134 | Exceptional 94.2% |
| Immigrants | Korea | 91.3 /100 | #135 | Exceptional 94.2% |
| Shoshone | 90.8 /100 | #136 | Exceptional 94.2% |
| Arapaho | 90.5 /100 | #137 | Exceptional 94.2% |
| Immigrants | Sri Lanka | 89.9 /100 | #138 | Excellent 94.2% |
| Immigrants | Bosnia and Herzegovina | 89.4 /100 | #139 | Excellent 94.2% |
| Immigrants | Jordan | 87.6 /100 | #140 | Excellent 94.1% |
| Hmong | 86.6 /100 | #141 | Excellent 94.1% |
| Albanians | 86.5 /100 | #142 | Excellent 94.1% |
| Cherokee | 84.9 /100 | #143 | Excellent 94.1% |
| Immigrants | Kazakhstan | 84.9 /100 | #144 | Excellent 94.1% |
| Immigrants | Nonimmigrants | 83.8 /100 | #145 | Excellent 94.1% |
| Chickasaw | 82.6 /100 | #146 | Excellent 94.1% |
| Immigrants | Ukraine | 81.5 /100 | #147 | Excellent 94.0% |
| Arabs | 80.9 /100 | #148 | Excellent 94.0% |
Demographics Similar to British by 10th Grade
In terms of 10th grade, the demographic groups most similar to British are Iranian (95.3%, a difference of 0.010%), Hungarian (95.3%, a difference of 0.010%), French (95.3%, a difference of 0.010%), Estonian (95.3%, a difference of 0.010%), and Immigrants from India (95.3%, a difference of 0.020%).
| Demographics | Rating | Rank | 10th Grade |
| Alaskan Athabascans | 100.0 /100 | #27 | Exceptional 95.4% |
| Luxembourgers | 100.0 /100 | #28 | Exceptional 95.4% |
| Bulgarians | 100.0 /100 | #29 | Exceptional 95.4% |
| Belgians | 100.0 /100 | #30 | Exceptional 95.4% |
| Iranians | 100.0 /100 | #31 | Exceptional 95.3% |
| Hungarians | 100.0 /100 | #32 | Exceptional 95.3% |
| French | 100.0 /100 | #33 | Exceptional 95.3% |
| British | 99.9 /100 | #34 | Exceptional 95.3% |
| Estonians | 99.9 /100 | #35 | Exceptional 95.3% |
| Immigrants | India | 99.9 /100 | #36 | Exceptional 95.3% |
| French Canadians | 99.9 /100 | #37 | Exceptional 95.3% |
| Northern Europeans | 99.9 /100 | #38 | Exceptional 95.3% |
| Immigrants | Scotland | 99.9 /100 | #39 | Exceptional 95.2% |
| Scotch-Irish | 99.9 /100 | #40 | Exceptional 95.2% |
| Russians | 99.9 /100 | #41 | Exceptional 95.2% |