Hmong vs Immigrants from Philippines 10th Grade
COMPARE
Hmong
Immigrants from Philippines
10th Grade
10th Grade Comparison
Hmong
Immigrants from Philippines
94.1%
10TH GRADE
86.6/ 100
METRIC RATING
141st/ 347
METRIC RANK
92.6%
10TH GRADE
0.4/ 100
METRIC RATING
266th/ 347
METRIC RANK
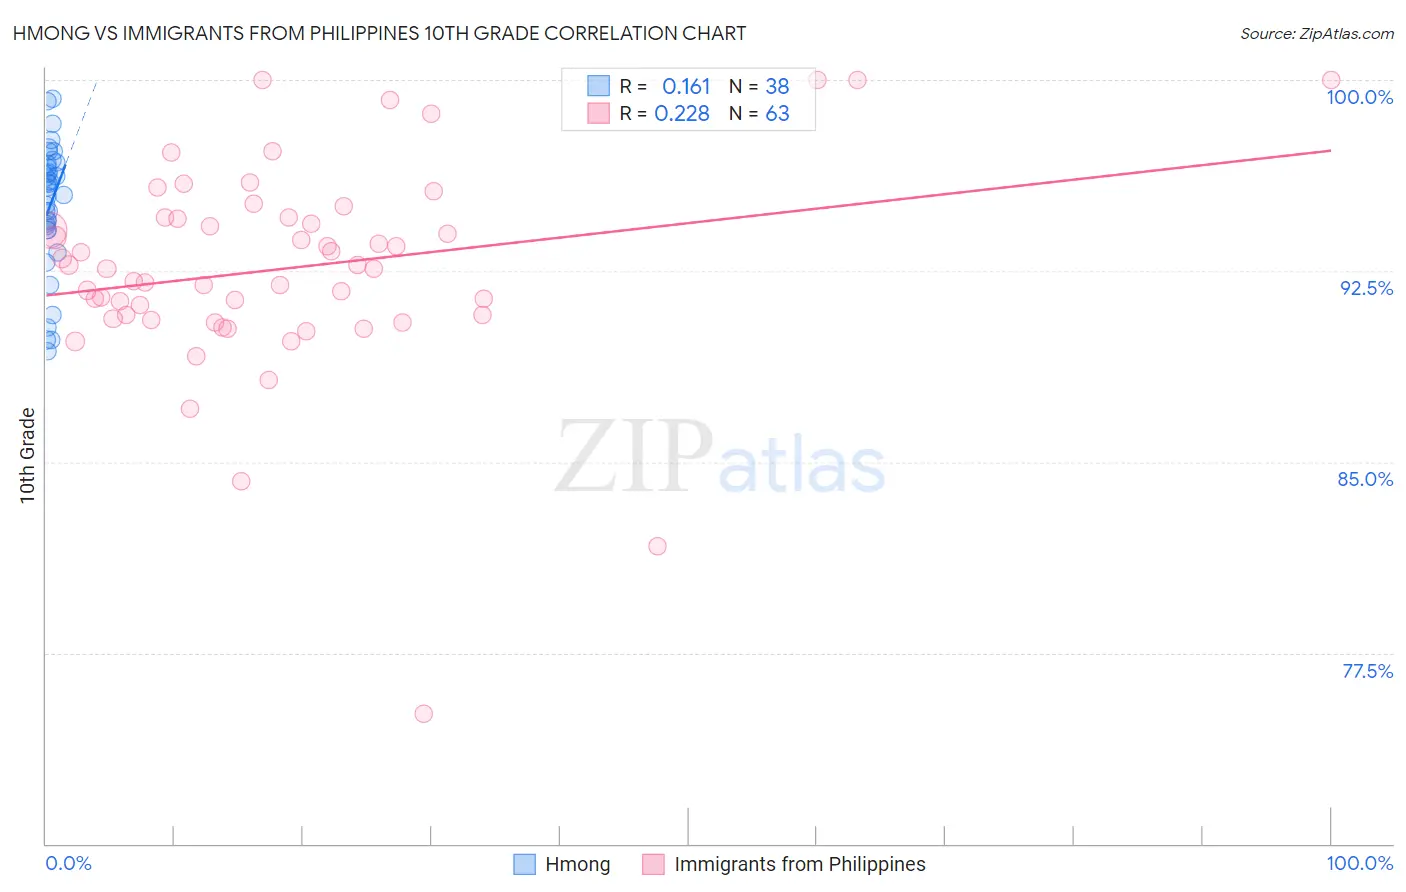
Hmong vs Immigrants from Philippines 10th Grade Correlation Chart
The statistical analysis conducted on geographies consisting of 24,672,093 people shows a poor positive correlation between the proportion of Hmong and percentage of population with at least 10th grade education in the United States with a correlation coefficient (R) of 0.161 and weighted average of 94.1%. Similarly, the statistical analysis conducted on geographies consisting of 471,300,535 people shows a weak positive correlation between the proportion of Immigrants from Philippines and percentage of population with at least 10th grade education in the United States with a correlation coefficient (R) of 0.228 and weighted average of 92.6%, a difference of 1.7%.
10th Grade Correlation Summary
| Measurement | Hmong | Immigrants from Philippines |
| Minimum | 89.3% | 75.1% |
| Maximum | 99.2% | 100.0% |
| Range | 9.9% | 24.9% |
| Mean | 95.0% | 92.6% |
| Median | 95.6% | 92.6% |
| Interquartile 25% (IQ1) | 94.1% | 90.6% |
| Interquartile 75% (IQ3) | 96.7% | 94.6% |
| Interquartile Range (IQR) | 2.6% | 4.0% |
| Standard Deviation (Sample) | 2.5% | 4.1% |
| Standard Deviation (Population) | 2.5% | 4.1% |
Similar Demographics by 10th Grade
Demographics Similar to Hmong by 10th Grade
In terms of 10th grade, the demographic groups most similar to Hmong are Albanian (94.1%, a difference of 0.0%), Immigrants from Jordan (94.1%, a difference of 0.020%), Cherokee (94.1%, a difference of 0.030%), Immigrants from Kazakhstan (94.1%, a difference of 0.030%), and Nonimmigrants (94.1%, a difference of 0.050%).
| Demographics | Rating | Rank | 10th Grade |
| Osage | 91.7 /100 | #134 | Exceptional 94.2% |
| Immigrants | Korea | 91.3 /100 | #135 | Exceptional 94.2% |
| Shoshone | 90.8 /100 | #136 | Exceptional 94.2% |
| Arapaho | 90.5 /100 | #137 | Exceptional 94.2% |
| Immigrants | Sri Lanka | 89.9 /100 | #138 | Excellent 94.2% |
| Immigrants | Bosnia and Herzegovina | 89.4 /100 | #139 | Excellent 94.2% |
| Immigrants | Jordan | 87.6 /100 | #140 | Excellent 94.1% |
| Hmong | 86.6 /100 | #141 | Excellent 94.1% |
| Albanians | 86.5 /100 | #142 | Excellent 94.1% |
| Cherokee | 84.9 /100 | #143 | Excellent 94.1% |
| Immigrants | Kazakhstan | 84.9 /100 | #144 | Excellent 94.1% |
| Immigrants | Nonimmigrants | 83.8 /100 | #145 | Excellent 94.1% |
| Chickasaw | 82.6 /100 | #146 | Excellent 94.1% |
| Immigrants | Ukraine | 81.5 /100 | #147 | Excellent 94.0% |
| Arabs | 80.9 /100 | #148 | Excellent 94.0% |
Demographics Similar to Immigrants from Philippines by 10th Grade
In terms of 10th grade, the demographic groups most similar to Immigrants from Philippines are Dutch West Indian (92.6%, a difference of 0.0%), Taiwanese (92.5%, a difference of 0.010%), Immigrants from Ghana (92.5%, a difference of 0.010%), Immigrants from South America (92.6%, a difference of 0.030%), and Apache (92.6%, a difference of 0.030%).
| Demographics | Rating | Rank | 10th Grade |
| Immigrants | Jamaica | 0.5 /100 | #259 | Tragic 92.6% |
| Immigrants | Uzbekistan | 0.5 /100 | #260 | Tragic 92.6% |
| Paiute | 0.4 /100 | #261 | Tragic 92.6% |
| Immigrants | South America | 0.4 /100 | #262 | Tragic 92.6% |
| Apache | 0.4 /100 | #263 | Tragic 92.6% |
| Peruvians | 0.4 /100 | #264 | Tragic 92.6% |
| Dutch West Indians | 0.4 /100 | #265 | Tragic 92.6% |
| Immigrants | Philippines | 0.4 /100 | #266 | Tragic 92.6% |
| Taiwanese | 0.3 /100 | #267 | Tragic 92.5% |
| Immigrants | Ghana | 0.3 /100 | #268 | Tragic 92.5% |
| Immigrants | Colombia | 0.3 /100 | #269 | Tragic 92.5% |
| Immigrants | Uruguay | 0.3 /100 | #270 | Tragic 92.5% |
| Immigrants | Eritrea | 0.3 /100 | #271 | Tragic 92.5% |
| Immigrants | Western Africa | 0.3 /100 | #272 | Tragic 92.5% |
| Trinidadians and Tobagonians | 0.2 /100 | #273 | Tragic 92.4% |