Hmong vs Kenyan No Schooling Completed
COMPARE
Hmong
Kenyan
No Schooling Completed
No Schooling Completed Comparison
Hmong
Kenyans
1.9%
NO SCHOOLING COMPLETED
88.5/ 100
METRIC RATING
135th/ 347
METRIC RANK
2.0%
NO SCHOOLING COMPLETED
65.7/ 100
METRIC RATING
160th/ 347
METRIC RANK
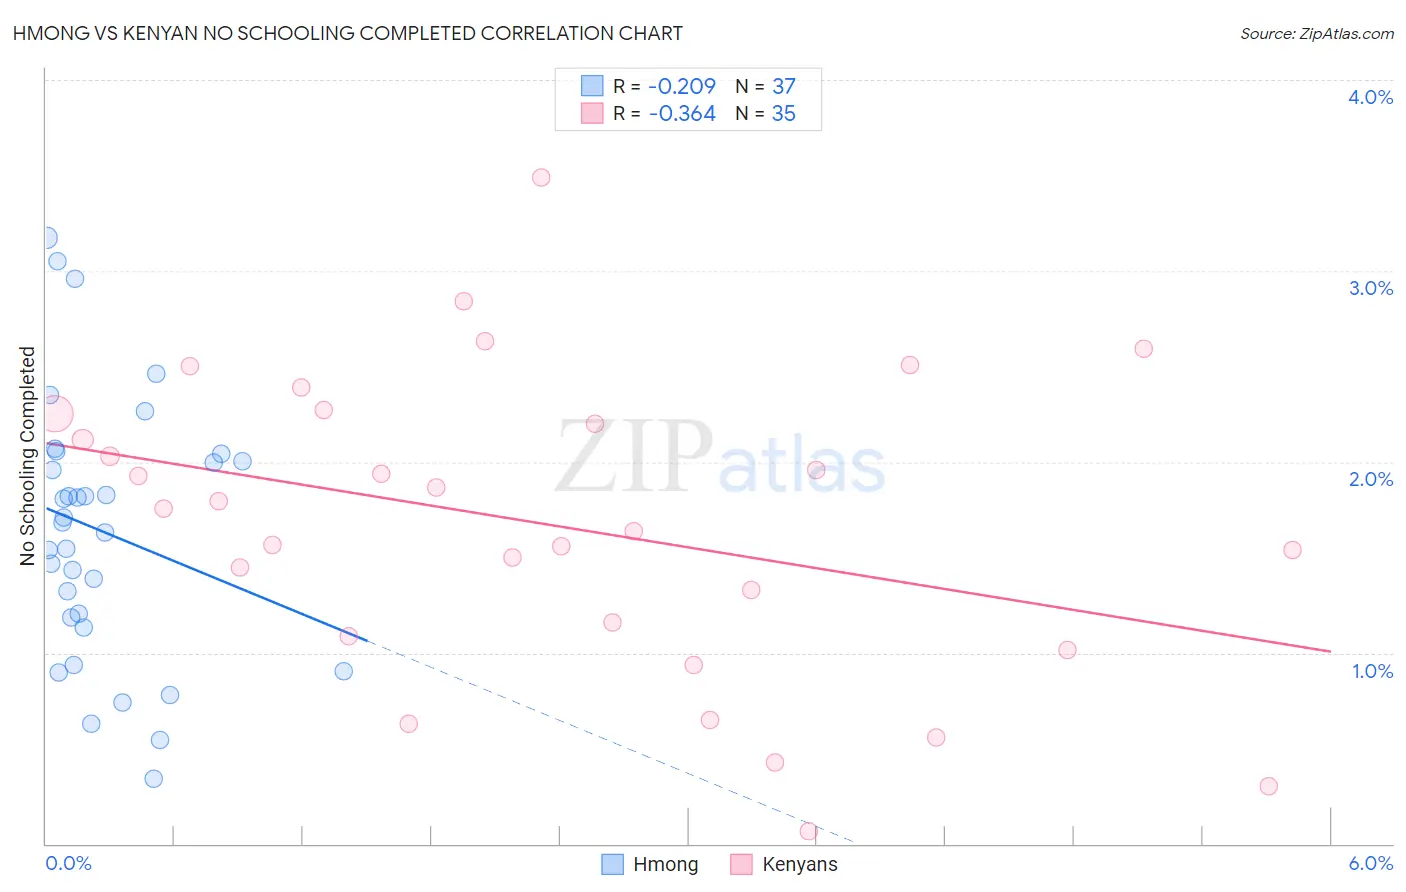
Hmong vs Kenyan No Schooling Completed Correlation Chart
The statistical analysis conducted on geographies consisting of 24,657,468 people shows a weak negative correlation between the proportion of Hmong and percentage of population with no schooling in the United States with a correlation coefficient (R) of -0.209 and weighted average of 1.9%. Similarly, the statistical analysis conducted on geographies consisting of 167,616,465 people shows a mild negative correlation between the proportion of Kenyans and percentage of population with no schooling in the United States with a correlation coefficient (R) of -0.364 and weighted average of 2.0%, a difference of 5.0%.
No Schooling Completed Correlation Summary
| Measurement | Hmong | Kenyan |
| Minimum | 0.34% | 0.067% |
| Maximum | 3.2% | 3.5% |
| Range | 2.8% | 3.4% |
| Mean | 1.6% | 1.7% |
| Median | 1.7% | 1.8% |
| Interquartile 25% (IQ1) | 1.2% | 1.1% |
| Interquartile 75% (IQ3) | 2.0% | 2.3% |
| Interquartile Range (IQR) | 0.86% | 1.2% |
| Standard Deviation (Sample) | 0.68% | 0.79% |
| Standard Deviation (Population) | 0.67% | 0.78% |
Similar Demographics by No Schooling Completed
Demographics Similar to Hmong by No Schooling Completed
In terms of no schooling completed, the demographic groups most similar to Hmong are Burmese (1.9%, a difference of 0.090%), Menominee (1.9%, a difference of 0.40%), Immigrants from Turkey (1.9%, a difference of 0.65%), Colville (1.9%, a difference of 0.75%), and Filipino (2.0%, a difference of 0.95%).
| Demographics | Rating | Rank | No Schooling Completed |
| Spaniards | 92.3 /100 | #128 | Exceptional 1.9% |
| Seminole | 92.0 /100 | #129 | Exceptional 1.9% |
| Palestinians | 91.8 /100 | #130 | Exceptional 1.9% |
| Immigrants | Hungary | 91.6 /100 | #131 | Exceptional 1.9% |
| Colville | 90.4 /100 | #132 | Exceptional 1.9% |
| Immigrants | Turkey | 90.2 /100 | #133 | Exceptional 1.9% |
| Menominee | 89.6 /100 | #134 | Excellent 1.9% |
| Hmong | 88.5 /100 | #135 | Excellent 1.9% |
| Burmese | 88.2 /100 | #136 | Excellent 1.9% |
| Filipinos | 85.5 /100 | #137 | Excellent 2.0% |
| Immigrants | Israel | 85.4 /100 | #138 | Excellent 2.0% |
| Jordanians | 84.5 /100 | #139 | Excellent 2.0% |
| Marshallese | 83.5 /100 | #140 | Excellent 2.0% |
| Immigrants | Greece | 83.5 /100 | #141 | Excellent 2.0% |
| Venezuelans | 81.5 /100 | #142 | Excellent 2.0% |
Demographics Similar to Kenyans by No Schooling Completed
In terms of no schooling completed, the demographic groups most similar to Kenyans are Immigrants from Spain (2.0%, a difference of 0.12%), Immigrants from Korea (2.0%, a difference of 0.16%), Ugandan (2.0%, a difference of 0.17%), Immigrants from Sri Lanka (2.0%, a difference of 0.20%), and Chilean (2.0%, a difference of 0.24%).
| Demographics | Rating | Rank | No Schooling Completed |
| Immigrants | Italy | 68.9 /100 | #153 | Good 2.0% |
| Immigrants | Venezuela | 68.5 /100 | #154 | Good 2.0% |
| Immigrants | Russia | 67.6 /100 | #155 | Good 2.0% |
| Chileans | 67.2 /100 | #156 | Good 2.0% |
| Immigrants | Sri Lanka | 67.0 /100 | #157 | Good 2.0% |
| Immigrants | Korea | 66.7 /100 | #158 | Good 2.0% |
| Immigrants | Spain | 66.4 /100 | #159 | Good 2.0% |
| Kenyans | 65.7 /100 | #160 | Good 2.0% |
| Ugandans | 64.6 /100 | #161 | Good 2.0% |
| Immigrants | Brazil | 63.8 /100 | #162 | Good 2.1% |
| Albanians | 62.2 /100 | #163 | Good 2.1% |
| Comanche | 60.7 /100 | #164 | Good 2.1% |
| Brazilians | 60.2 /100 | #165 | Good 2.1% |
| Dutch West Indians | 59.9 /100 | #166 | Average 2.1% |
| Egyptians | 59.2 /100 | #167 | Average 2.1% |