Hmong vs Burmese No Schooling Completed
COMPARE
Hmong
Burmese
No Schooling Completed
No Schooling Completed Comparison
Hmong
Burmese
1.9%
NO SCHOOLING COMPLETED
88.5/ 100
METRIC RATING
135th/ 347
METRIC RANK
1.9%
NO SCHOOLING COMPLETED
88.2/ 100
METRIC RATING
136th/ 347
METRIC RANK
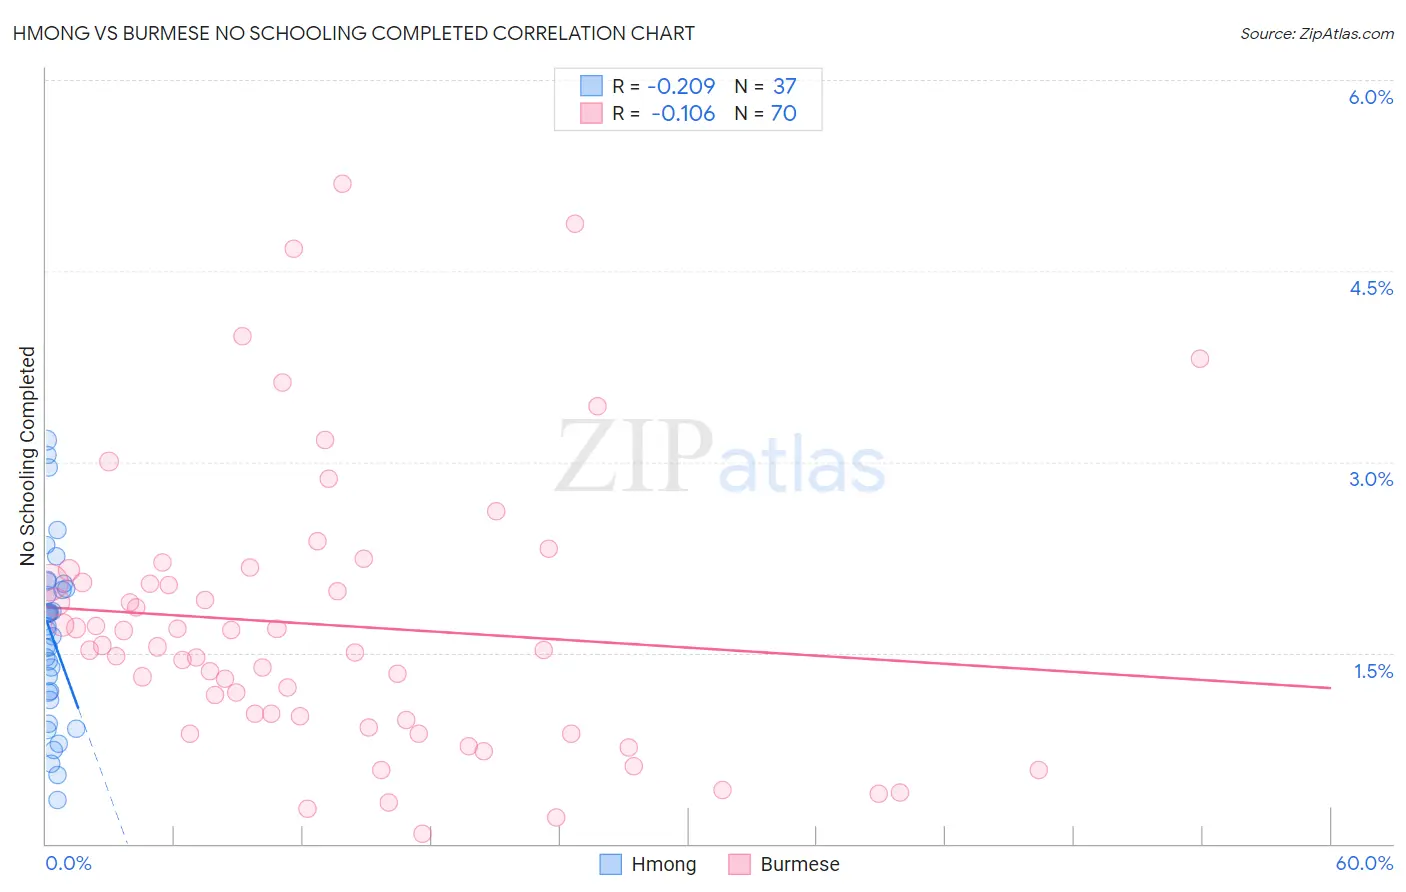
Hmong vs Burmese No Schooling Completed Correlation Chart
The statistical analysis conducted on geographies consisting of 24,657,468 people shows a weak negative correlation between the proportion of Hmong and percentage of population with no schooling in the United States with a correlation coefficient (R) of -0.209 and weighted average of 1.9%. Similarly, the statistical analysis conducted on geographies consisting of 458,309,119 people shows a poor negative correlation between the proportion of Burmese and percentage of population with no schooling in the United States with a correlation coefficient (R) of -0.106 and weighted average of 1.9%, a difference of 0.090%.
No Schooling Completed Correlation Summary
| Measurement | Hmong | Burmese |
| Minimum | 0.34% | 0.081% |
| Maximum | 3.2% | 5.2% |
| Range | 2.8% | 5.1% |
| Mean | 1.6% | 1.7% |
| Median | 1.7% | 1.5% |
| Interquartile 25% (IQ1) | 1.2% | 0.98% |
| Interquartile 75% (IQ3) | 2.0% | 2.1% |
| Interquartile Range (IQR) | 0.86% | 1.1% |
| Standard Deviation (Sample) | 0.68% | 1.1% |
| Standard Deviation (Population) | 0.67% | 1.1% |
Demographics Similar to Hmong and Burmese by No Schooling Completed
In terms of no schooling completed, the demographic groups most similar to Hmong are Menominee (1.9%, a difference of 0.40%), Immigrants from Turkey (1.9%, a difference of 0.65%), Colville (1.9%, a difference of 0.75%), Filipino (2.0%, a difference of 0.95%), and Immigrants from Israel (2.0%, a difference of 0.98%). Similarly, the demographic groups most similar to Burmese are Menominee (1.9%, a difference of 0.49%), Immigrants from Turkey (1.9%, a difference of 0.74%), Colville (1.9%, a difference of 0.84%), Filipino (2.0%, a difference of 0.86%), and Immigrants from Israel (2.0%, a difference of 0.89%).
| Demographics | Rating | Rank | No Schooling Completed |
| Immigrants | Europe | 93.7 /100 | #125 | Exceptional 1.9% |
| Immigrants | Romania | 92.6 /100 | #126 | Exceptional 1.9% |
| Israelis | 92.4 /100 | #127 | Exceptional 1.9% |
| Spaniards | 92.3 /100 | #128 | Exceptional 1.9% |
| Seminole | 92.0 /100 | #129 | Exceptional 1.9% |
| Palestinians | 91.8 /100 | #130 | Exceptional 1.9% |
| Immigrants | Hungary | 91.6 /100 | #131 | Exceptional 1.9% |
| Colville | 90.4 /100 | #132 | Exceptional 1.9% |
| Immigrants | Turkey | 90.2 /100 | #133 | Exceptional 1.9% |
| Menominee | 89.6 /100 | #134 | Excellent 1.9% |
| Hmong | 88.5 /100 | #135 | Excellent 1.9% |
| Burmese | 88.2 /100 | #136 | Excellent 1.9% |
| Filipinos | 85.5 /100 | #137 | Excellent 2.0% |
| Immigrants | Israel | 85.4 /100 | #138 | Excellent 2.0% |
| Jordanians | 84.5 /100 | #139 | Excellent 2.0% |
| Marshallese | 83.5 /100 | #140 | Excellent 2.0% |
| Immigrants | Greece | 83.5 /100 | #141 | Excellent 2.0% |
| Venezuelans | 81.5 /100 | #142 | Excellent 2.0% |
| Immigrants | South Central Asia | 80.0 /100 | #143 | Good 2.0% |
| Alsatians | 79.1 /100 | #144 | Good 2.0% |
| Immigrants | Iran | 79.0 /100 | #145 | Good 2.0% |