Hmong vs Scottish No Schooling Completed
COMPARE
Hmong
Scottish
No Schooling Completed
No Schooling Completed Comparison
Hmong
Scottish
1.9%
NO SCHOOLING COMPLETED
88.5/ 100
METRIC RATING
135th/ 347
METRIC RANK
1.4%
NO SCHOOLING COMPLETED
100.0/ 100
METRIC RATING
9th/ 347
METRIC RANK
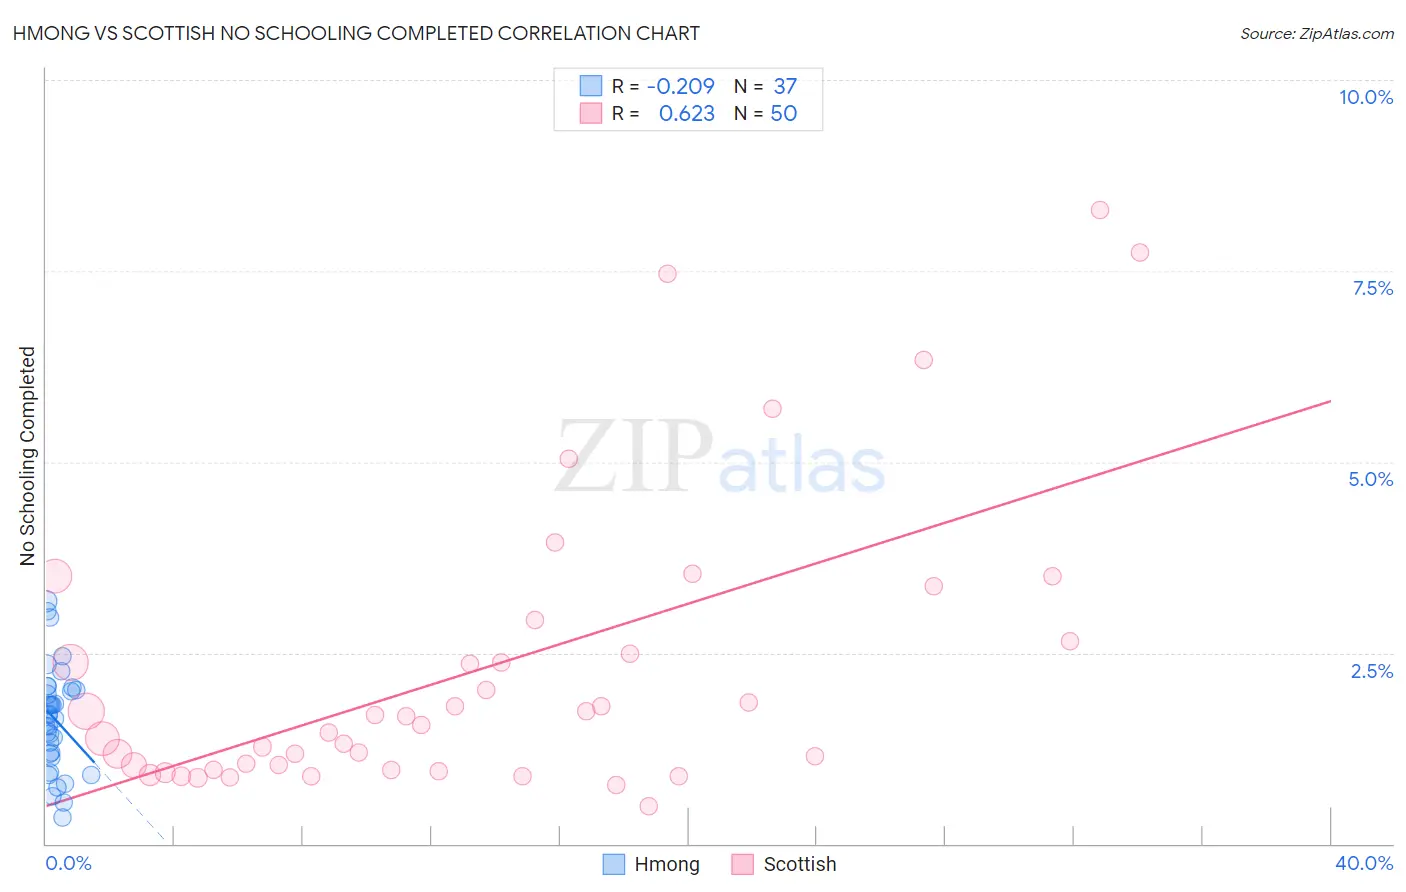
Hmong vs Scottish No Schooling Completed Correlation Chart
The statistical analysis conducted on geographies consisting of 24,657,468 people shows a weak negative correlation between the proportion of Hmong and percentage of population with no schooling in the United States with a correlation coefficient (R) of -0.209 and weighted average of 1.9%. Similarly, the statistical analysis conducted on geographies consisting of 548,415,962 people shows a significant positive correlation between the proportion of Scottish and percentage of population with no schooling in the United States with a correlation coefficient (R) of 0.623 and weighted average of 1.4%, a difference of 37.8%.
No Schooling Completed Correlation Summary
| Measurement | Hmong | Scottish |
| Minimum | 0.34% | 0.50% |
| Maximum | 3.2% | 8.3% |
| Range | 2.8% | 7.8% |
| Mean | 1.6% | 2.3% |
| Median | 1.7% | 1.6% |
| Interquartile 25% (IQ1) | 1.2% | 0.97% |
| Interquartile 75% (IQ3) | 2.0% | 2.7% |
| Interquartile Range (IQR) | 0.86% | 1.7% |
| Standard Deviation (Sample) | 0.68% | 1.9% |
| Standard Deviation (Population) | 0.67% | 1.9% |
Similar Demographics by No Schooling Completed
Demographics Similar to Hmong by No Schooling Completed
In terms of no schooling completed, the demographic groups most similar to Hmong are Burmese (1.9%, a difference of 0.090%), Menominee (1.9%, a difference of 0.40%), Immigrants from Turkey (1.9%, a difference of 0.65%), Colville (1.9%, a difference of 0.75%), and Filipino (2.0%, a difference of 0.95%).
| Demographics | Rating | Rank | No Schooling Completed |
| Spaniards | 92.3 /100 | #128 | Exceptional 1.9% |
| Seminole | 92.0 /100 | #129 | Exceptional 1.9% |
| Palestinians | 91.8 /100 | #130 | Exceptional 1.9% |
| Immigrants | Hungary | 91.6 /100 | #131 | Exceptional 1.9% |
| Colville | 90.4 /100 | #132 | Exceptional 1.9% |
| Immigrants | Turkey | 90.2 /100 | #133 | Exceptional 1.9% |
| Menominee | 89.6 /100 | #134 | Excellent 1.9% |
| Hmong | 88.5 /100 | #135 | Excellent 1.9% |
| Burmese | 88.2 /100 | #136 | Excellent 1.9% |
| Filipinos | 85.5 /100 | #137 | Excellent 2.0% |
| Immigrants | Israel | 85.4 /100 | #138 | Excellent 2.0% |
| Jordanians | 84.5 /100 | #139 | Excellent 2.0% |
| Marshallese | 83.5 /100 | #140 | Excellent 2.0% |
| Immigrants | Greece | 83.5 /100 | #141 | Excellent 2.0% |
| Venezuelans | 81.5 /100 | #142 | Excellent 2.0% |
Demographics Similar to Scottish by No Schooling Completed
In terms of no schooling completed, the demographic groups most similar to Scottish are Swedish (1.4%, a difference of 0.53%), Dutch (1.4%, a difference of 0.80%), Lithuanian (1.4%, a difference of 1.6%), Irish (1.4%, a difference of 1.7%), and Polish (1.4%, a difference of 1.7%).
| Demographics | Rating | Rank | No Schooling Completed |
| Slovaks | 100.0 /100 | #2 | Exceptional 1.3% |
| Norwegians | 100.0 /100 | #3 | Exceptional 1.3% |
| Germans | 100.0 /100 | #4 | Exceptional 1.4% |
| Slovenes | 100.0 /100 | #5 | Exceptional 1.4% |
| Carpatho Rusyns | 100.0 /100 | #6 | Exceptional 1.4% |
| English | 100.0 /100 | #7 | Exceptional 1.4% |
| Swedes | 100.0 /100 | #8 | Exceptional 1.4% |
| Scottish | 100.0 /100 | #9 | Exceptional 1.4% |
| Dutch | 100.0 /100 | #10 | Exceptional 1.4% |
| Lithuanians | 100.0 /100 | #11 | Exceptional 1.4% |
| Irish | 100.0 /100 | #12 | Exceptional 1.4% |
| Poles | 100.0 /100 | #13 | Exceptional 1.4% |
| Scotch-Irish | 100.0 /100 | #14 | Exceptional 1.5% |
| Tlingit-Haida | 100.0 /100 | #15 | Exceptional 1.5% |
| Finns | 100.0 /100 | #16 | Exceptional 1.5% |