Hmong vs Immigrants from Indonesia No Schooling Completed
COMPARE
Hmong
Immigrants from Indonesia
No Schooling Completed
No Schooling Completed Comparison
Hmong
Immigrants from Indonesia
1.9%
NO SCHOOLING COMPLETED
88.5/ 100
METRIC RATING
135th/ 347
METRIC RANK
2.4%
NO SCHOOLING COMPLETED
1.5/ 100
METRIC RATING
242nd/ 347
METRIC RANK
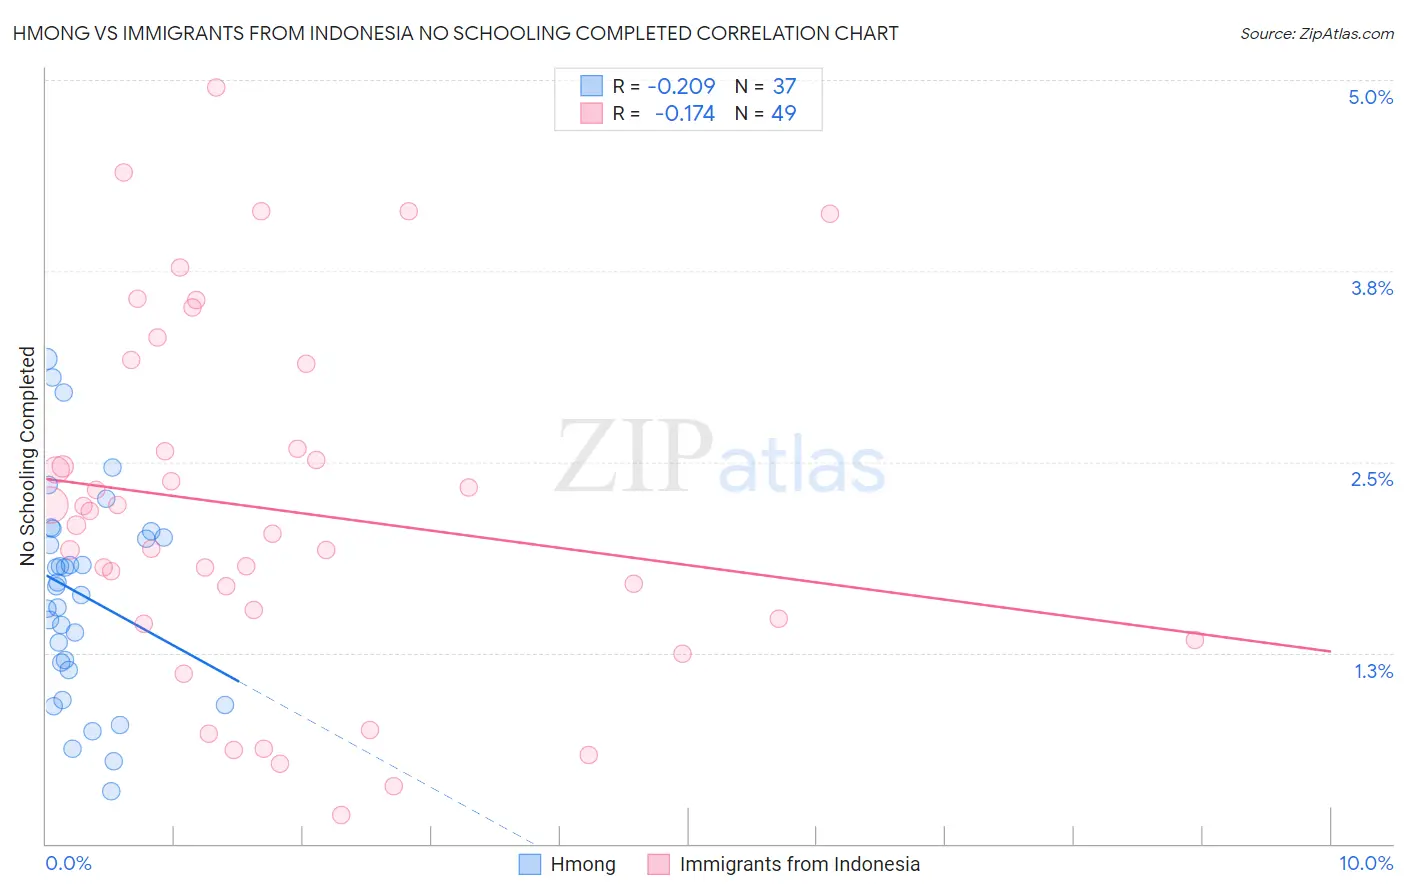
Hmong vs Immigrants from Indonesia No Schooling Completed Correlation Chart
The statistical analysis conducted on geographies consisting of 24,657,468 people shows a weak negative correlation between the proportion of Hmong and percentage of population with no schooling in the United States with a correlation coefficient (R) of -0.209 and weighted average of 1.9%. Similarly, the statistical analysis conducted on geographies consisting of 214,703,374 people shows a poor negative correlation between the proportion of Immigrants from Indonesia and percentage of population with no schooling in the United States with a correlation coefficient (R) of -0.174 and weighted average of 2.4%, a difference of 22.5%.
No Schooling Completed Correlation Summary
| Measurement | Hmong | Immigrants from Indonesia |
| Minimum | 0.34% | 0.18% |
| Maximum | 3.2% | 4.9% |
| Range | 2.8% | 4.8% |
| Mean | 1.6% | 2.2% |
| Median | 1.7% | 2.1% |
| Interquartile 25% (IQ1) | 1.2% | 1.5% |
| Interquartile 75% (IQ3) | 2.0% | 2.9% |
| Interquartile Range (IQR) | 0.86% | 1.4% |
| Standard Deviation (Sample) | 0.68% | 1.1% |
| Standard Deviation (Population) | 0.67% | 1.1% |
Similar Demographics by No Schooling Completed
Demographics Similar to Hmong by No Schooling Completed
In terms of no schooling completed, the demographic groups most similar to Hmong are Burmese (1.9%, a difference of 0.090%), Menominee (1.9%, a difference of 0.40%), Immigrants from Turkey (1.9%, a difference of 0.65%), Colville (1.9%, a difference of 0.75%), and Filipino (2.0%, a difference of 0.95%).
| Demographics | Rating | Rank | No Schooling Completed |
| Spaniards | 92.3 /100 | #128 | Exceptional 1.9% |
| Seminole | 92.0 /100 | #129 | Exceptional 1.9% |
| Palestinians | 91.8 /100 | #130 | Exceptional 1.9% |
| Immigrants | Hungary | 91.6 /100 | #131 | Exceptional 1.9% |
| Colville | 90.4 /100 | #132 | Exceptional 1.9% |
| Immigrants | Turkey | 90.2 /100 | #133 | Exceptional 1.9% |
| Menominee | 89.6 /100 | #134 | Excellent 1.9% |
| Hmong | 88.5 /100 | #135 | Excellent 1.9% |
| Burmese | 88.2 /100 | #136 | Excellent 1.9% |
| Filipinos | 85.5 /100 | #137 | Excellent 2.0% |
| Immigrants | Israel | 85.4 /100 | #138 | Excellent 2.0% |
| Jordanians | 84.5 /100 | #139 | Excellent 2.0% |
| Marshallese | 83.5 /100 | #140 | Excellent 2.0% |
| Immigrants | Greece | 83.5 /100 | #141 | Excellent 2.0% |
| Venezuelans | 81.5 /100 | #142 | Excellent 2.0% |
Demographics Similar to Immigrants from Indonesia by No Schooling Completed
In terms of no schooling completed, the demographic groups most similar to Immigrants from Indonesia are South American (2.4%, a difference of 0.040%), Peruvian (2.4%, a difference of 0.14%), Bolivian (2.4%, a difference of 0.15%), Immigrants from Congo (2.4%, a difference of 0.20%), and Immigrants from Iraq (2.4%, a difference of 0.30%).
| Demographics | Rating | Rank | No Schooling Completed |
| Immigrants | Western Asia | 2.6 /100 | #235 | Tragic 2.3% |
| Iraqis | 2.2 /100 | #236 | Tragic 2.4% |
| Immigrants | Eastern Asia | 2.0 /100 | #237 | Tragic 2.4% |
| Paiute | 1.9 /100 | #238 | Tragic 2.4% |
| Liberians | 1.8 /100 | #239 | Tragic 2.4% |
| Immigrants | Senegal | 1.7 /100 | #240 | Tragic 2.4% |
| Koreans | 1.7 /100 | #241 | Tragic 2.4% |
| Immigrants | Indonesia | 1.5 /100 | #242 | Tragic 2.4% |
| South Americans | 1.5 /100 | #243 | Tragic 2.4% |
| Peruvians | 1.4 /100 | #244 | Tragic 2.4% |
| Bolivians | 1.4 /100 | #245 | Tragic 2.4% |
| Immigrants | Congo | 1.4 /100 | #246 | Tragic 2.4% |
| Immigrants | Iraq | 1.3 /100 | #247 | Tragic 2.4% |
| Asians | 1.2 /100 | #248 | Tragic 2.4% |
| Jamaicans | 1.2 /100 | #249 | Tragic 2.4% |