Guyanese vs Immigrants from Nepal Associate's Degree
COMPARE
Guyanese
Immigrants from Nepal
Associate's Degree
Associate's Degree Comparison
Guyanese
Immigrants from Nepal
42.3%
ASSOCIATE'S DEGREE
1.0/ 100
METRIC RATING
243rd/ 347
METRIC RANK
49.5%
ASSOCIATE'S DEGREE
97.5/ 100
METRIC RATING
100th/ 347
METRIC RANK
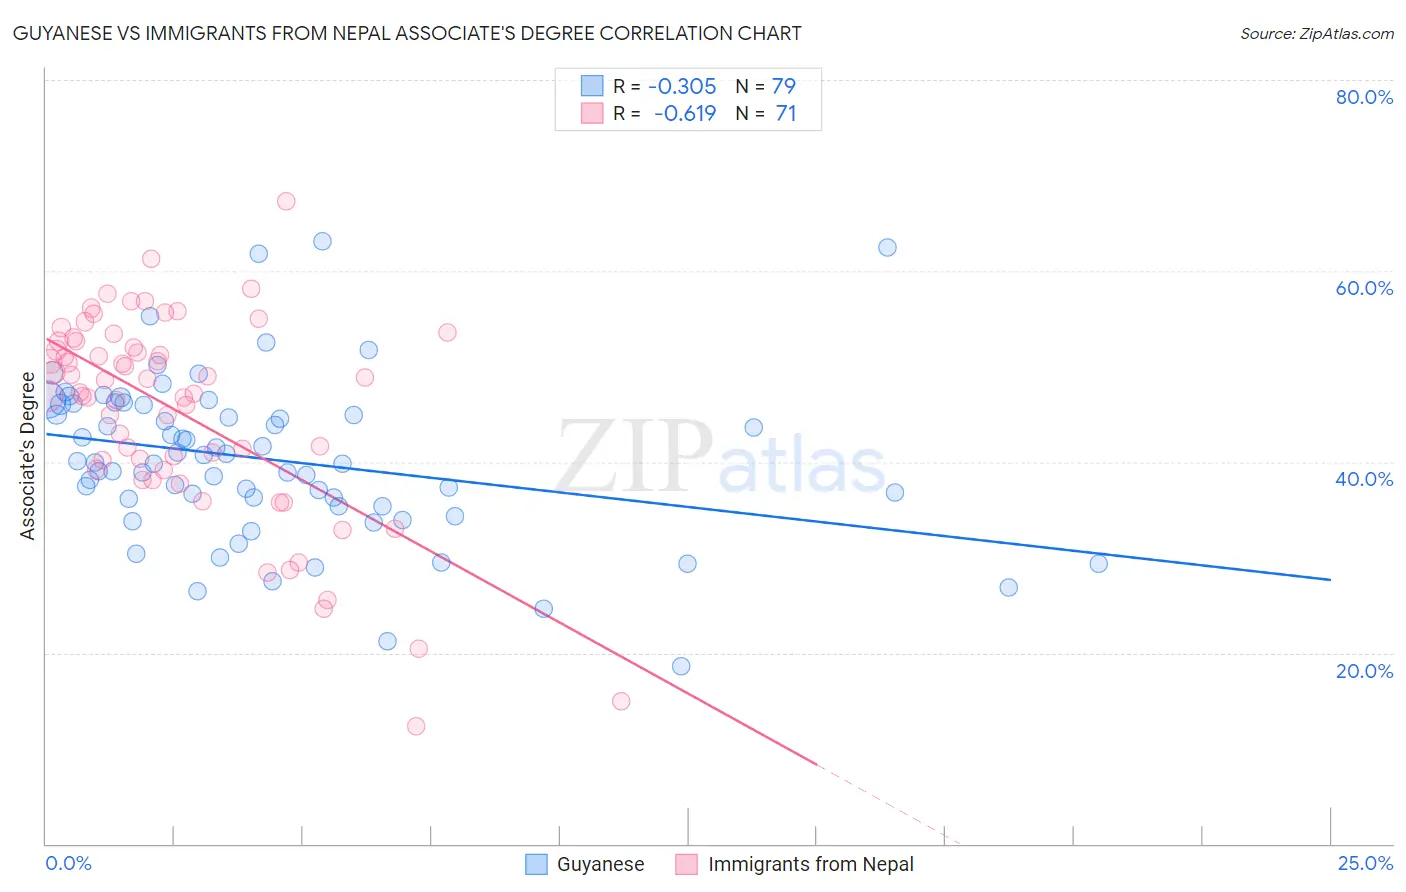
Guyanese vs Immigrants from Nepal Associate's Degree Correlation Chart
The statistical analysis conducted on geographies consisting of 176,923,835 people shows a mild negative correlation between the proportion of Guyanese and percentage of population with at least associate's degree education in the United States with a correlation coefficient (R) of -0.305 and weighted average of 42.3%. Similarly, the statistical analysis conducted on geographies consisting of 186,769,874 people shows a significant negative correlation between the proportion of Immigrants from Nepal and percentage of population with at least associate's degree education in the United States with a correlation coefficient (R) of -0.619 and weighted average of 49.5%, a difference of 17.0%.
Associate's Degree Correlation Summary
| Measurement | Guyanese | Immigrants from Nepal |
| Minimum | 18.6% | 12.3% |
| Maximum | 63.1% | 67.3% |
| Range | 44.5% | 55.0% |
| Mean | 40.2% | 45.2% |
| Median | 39.9% | 47.3% |
| Interquartile 25% (IQ1) | 35.4% | 39.2% |
| Interquartile 75% (IQ3) | 46.0% | 52.6% |
| Interquartile Range (IQR) | 10.6% | 13.3% |
| Standard Deviation (Sample) | 8.5% | 10.7% |
| Standard Deviation (Population) | 8.5% | 10.6% |
Similar Demographics by Associate's Degree
Demographics Similar to Guyanese by Associate's Degree
In terms of associate's degree, the demographic groups most similar to Guyanese are Immigrants from West Indies (42.4%, a difference of 0.11%), British West Indian (42.4%, a difference of 0.12%), Immigrants from Liberia (42.3%, a difference of 0.14%), Immigrants from Cambodia (42.3%, a difference of 0.16%), and Delaware (42.3%, a difference of 0.19%).
| Demographics | Rating | Rank | Associate's Degree |
| Immigrants | St. Vincent and the Grenadines | 1.9 /100 | #236 | Tragic 42.9% |
| Immigrants | Nonimmigrants | 1.9 /100 | #237 | Tragic 42.9% |
| Iroquois | 1.7 /100 | #238 | Tragic 42.8% |
| Immigrants | Grenada | 1.3 /100 | #239 | Tragic 42.6% |
| Cree | 1.2 /100 | #240 | Tragic 42.5% |
| British West Indians | 1.0 /100 | #241 | Tragic 42.4% |
| Immigrants | West Indies | 1.0 /100 | #242 | Tragic 42.4% |
| Guyanese | 1.0 /100 | #243 | Tragic 42.3% |
| Immigrants | Liberia | 0.9 /100 | #244 | Tragic 42.3% |
| Immigrants | Cambodia | 0.9 /100 | #245 | Tragic 42.3% |
| Delaware | 0.9 /100 | #246 | Tragic 42.3% |
| Immigrants | Fiji | 0.8 /100 | #247 | Tragic 42.2% |
| Immigrants | Ecuador | 0.8 /100 | #248 | Tragic 42.2% |
| Jamaicans | 0.7 /100 | #249 | Tragic 42.1% |
| U.S. Virgin Islanders | 0.7 /100 | #250 | Tragic 42.1% |
Demographics Similar to Immigrants from Nepal by Associate's Degree
In terms of associate's degree, the demographic groups most similar to Immigrants from Nepal are Northern European (49.5%, a difference of 0.16%), Chilean (49.4%, a difference of 0.19%), Macedonian (49.6%, a difference of 0.22%), Immigrants from Northern Africa (49.7%, a difference of 0.28%), and Ukrainian (49.4%, a difference of 0.29%).
| Demographics | Rating | Rank | Associate's Degree |
| Immigrants | Brazil | 98.5 /100 | #93 | Exceptional 50.0% |
| Laotians | 98.4 /100 | #94 | Exceptional 49.9% |
| Immigrants | England | 98.0 /100 | #95 | Exceptional 49.7% |
| Romanians | 98.0 /100 | #96 | Exceptional 49.7% |
| Immigrants | Ukraine | 98.0 /100 | #97 | Exceptional 49.7% |
| Immigrants | Northern Africa | 97.9 /100 | #98 | Exceptional 49.7% |
| Macedonians | 97.8 /100 | #99 | Exceptional 49.6% |
| Immigrants | Nepal | 97.5 /100 | #100 | Exceptional 49.5% |
| Northern Europeans | 97.3 /100 | #101 | Exceptional 49.5% |
| Chileans | 97.3 /100 | #102 | Exceptional 49.4% |
| Ukrainians | 97.1 /100 | #103 | Exceptional 49.4% |
| Venezuelans | 97.0 /100 | #104 | Exceptional 49.4% |
| Croatians | 96.8 /100 | #105 | Exceptional 49.3% |
| Immigrants | Italy | 96.7 /100 | #106 | Exceptional 49.3% |
| Syrians | 96.7 /100 | #107 | Exceptional 49.3% |