Guyanese vs Immigrants from Nepal Median Earnings
COMPARE
Guyanese
Immigrants from Nepal
Median Earnings
Median Earnings Comparison
Guyanese
Immigrants from Nepal
$45,470
MEDIAN EARNINGS
20.6/ 100
METRIC RATING
216th/ 347
METRIC RANK
$47,925
MEDIAN EARNINGS
89.0/ 100
METRIC RATING
137th/ 347
METRIC RANK
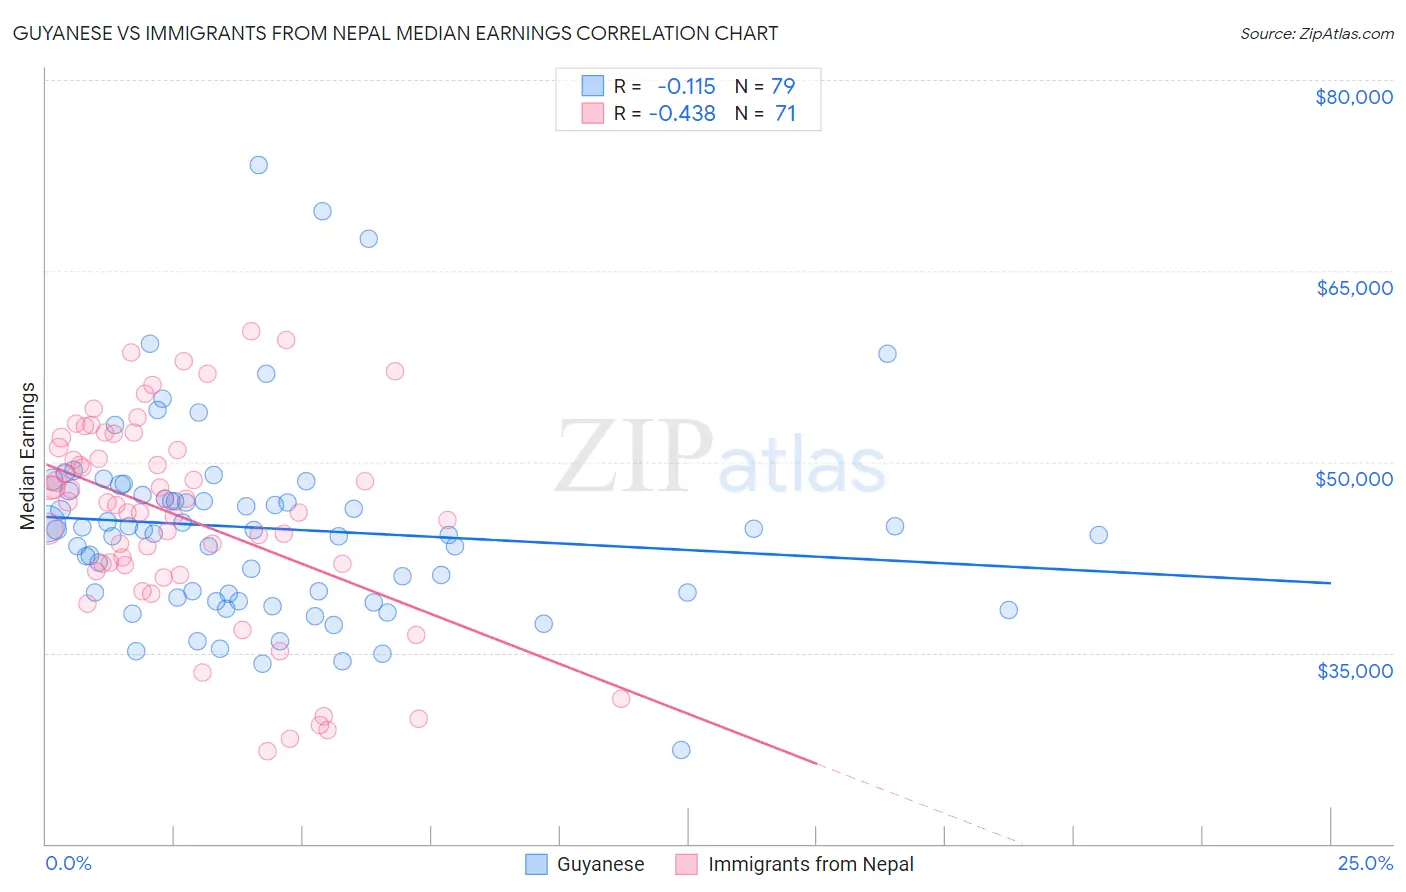
Guyanese vs Immigrants from Nepal Median Earnings Correlation Chart
The statistical analysis conducted on geographies consisting of 176,931,599 people shows a poor negative correlation between the proportion of Guyanese and median earnings in the United States with a correlation coefficient (R) of -0.115 and weighted average of $45,470. Similarly, the statistical analysis conducted on geographies consisting of 186,786,511 people shows a moderate negative correlation between the proportion of Immigrants from Nepal and median earnings in the United States with a correlation coefficient (R) of -0.438 and weighted average of $47,925, a difference of 5.4%.
Median Earnings Correlation Summary
| Measurement | Guyanese | Immigrants from Nepal |
| Minimum | $27,391 | $27,307 |
| Maximum | $73,355 | $60,227 |
| Range | $45,964 | $32,920 |
| Mean | $44,767 | $45,713 |
| Median | $44,635 | $46,771 |
| Interquartile 25% (IQ1) | $39,355 | $41,930 |
| Interquartile 75% (IQ3) | $47,401 | $51,099 |
| Interquartile Range (IQR) | $8,047 | $9,169 |
| Standard Deviation (Sample) | $7,735 | $7,950 |
| Standard Deviation (Population) | $7,686 | $7,894 |
Similar Demographics by Median Earnings
Demographics Similar to Guyanese by Median Earnings
In terms of median earnings, the demographic groups most similar to Guyanese are Tlingit-Haida ($45,468, a difference of 0.0%), Spanish ($45,432, a difference of 0.080%), Nigerian ($45,532, a difference of 0.14%), Immigrants from Bangladesh ($45,532, a difference of 0.14%), and Immigrants from Colombia ($45,550, a difference of 0.17%).
| Demographics | Rating | Rank | Median Earnings |
| Immigrants | Thailand | 23.7 /100 | #209 | Fair $45,598 |
| Immigrants | Grenada | 23.6 /100 | #210 | Fair $45,596 |
| Panamanians | 23.5 /100 | #211 | Fair $45,593 |
| Bermudans | 23.5 /100 | #212 | Fair $45,593 |
| Immigrants | Colombia | 22.4 /100 | #213 | Fair $45,550 |
| Nigerians | 22.0 /100 | #214 | Fair $45,532 |
| Immigrants | Bangladesh | 22.0 /100 | #215 | Fair $45,532 |
| Guyanese | 20.6 /100 | #216 | Fair $45,470 |
| Tlingit-Haida | 20.5 /100 | #217 | Fair $45,468 |
| Spanish | 19.7 /100 | #218 | Poor $45,432 |
| Dutch | 18.4 /100 | #219 | Poor $45,370 |
| Ecuadorians | 15.3 /100 | #220 | Poor $45,214 |
| Immigrants | Guyana | 15.1 /100 | #221 | Poor $45,204 |
| Immigrants | Panama | 15.0 /100 | #222 | Poor $45,198 |
| Whites/Caucasians | 15.0 /100 | #223 | Poor $45,197 |
Demographics Similar to Immigrants from Nepal by Median Earnings
In terms of median earnings, the demographic groups most similar to Immigrants from Nepal are European ($47,915, a difference of 0.020%), Canadian ($47,911, a difference of 0.030%), Taiwanese ($47,902, a difference of 0.050%), Immigrants from Sierra Leone ($47,875, a difference of 0.11%), and Slovene ($47,995, a difference of 0.15%).
| Demographics | Rating | Rank | Median Earnings |
| Zimbabweans | 92.6 /100 | #130 | Exceptional $48,229 |
| Lebanese | 92.5 /100 | #131 | Exceptional $48,226 |
| British | 92.2 /100 | #132 | Exceptional $48,189 |
| Immigrants | Uganda | 90.5 /100 | #133 | Exceptional $48,041 |
| Sri Lankans | 90.5 /100 | #134 | Exceptional $48,040 |
| Portuguese | 90.4 /100 | #135 | Exceptional $48,032 |
| Slovenes | 90.0 /100 | #136 | Excellent $47,995 |
| Immigrants | Nepal | 89.0 /100 | #137 | Excellent $47,925 |
| Europeans | 88.9 /100 | #138 | Excellent $47,915 |
| Canadians | 88.8 /100 | #139 | Excellent $47,911 |
| Taiwanese | 88.7 /100 | #140 | Excellent $47,902 |
| Immigrants | Sierra Leone | 88.3 /100 | #141 | Excellent $47,875 |
| Ugandans | 88.0 /100 | #142 | Excellent $47,854 |
| Swedes | 88.0 /100 | #143 | Excellent $47,851 |
| Hungarians | 87.1 /100 | #144 | Excellent $47,795 |