Guyanese vs Immigrants from Israel Associate's Degree
COMPARE
Guyanese
Immigrants from Israel
Associate's Degree
Associate's Degree Comparison
Guyanese
Immigrants from Israel
42.3%
ASSOCIATE'S DEGREE
1.0/ 100
METRIC RATING
243rd/ 347
METRIC RANK
56.8%
ASSOCIATE'S DEGREE
100.0/ 100
METRIC RATING
9th/ 347
METRIC RANK
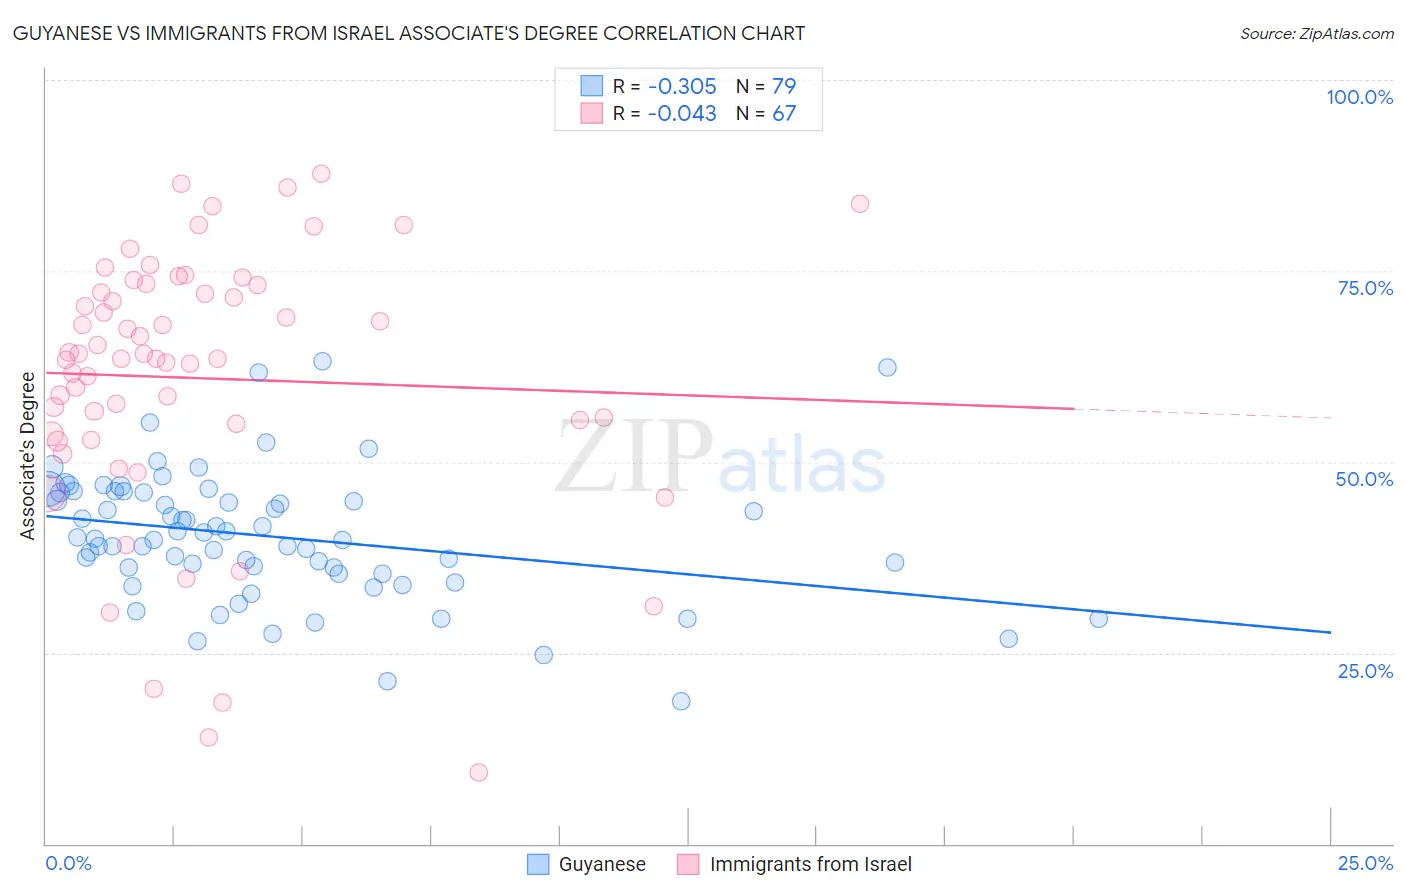
Guyanese vs Immigrants from Israel Associate's Degree Correlation Chart
The statistical analysis conducted on geographies consisting of 176,923,835 people shows a mild negative correlation between the proportion of Guyanese and percentage of population with at least associate's degree education in the United States with a correlation coefficient (R) of -0.305 and weighted average of 42.3%. Similarly, the statistical analysis conducted on geographies consisting of 210,027,202 people shows no correlation between the proportion of Immigrants from Israel and percentage of population with at least associate's degree education in the United States with a correlation coefficient (R) of -0.043 and weighted average of 56.8%, a difference of 34.2%.
Associate's Degree Correlation Summary
| Measurement | Guyanese | Immigrants from Israel |
| Minimum | 18.6% | 9.3% |
| Maximum | 63.1% | 87.7% |
| Range | 44.5% | 78.4% |
| Mean | 40.2% | 61.0% |
| Median | 39.9% | 63.5% |
| Interquartile 25% (IQ1) | 35.4% | 53.7% |
| Interquartile 75% (IQ3) | 46.0% | 73.2% |
| Interquartile Range (IQR) | 10.6% | 19.5% |
| Standard Deviation (Sample) | 8.5% | 17.4% |
| Standard Deviation (Population) | 8.5% | 17.3% |
Similar Demographics by Associate's Degree
Demographics Similar to Guyanese by Associate's Degree
In terms of associate's degree, the demographic groups most similar to Guyanese are Immigrants from West Indies (42.4%, a difference of 0.11%), British West Indian (42.4%, a difference of 0.12%), Immigrants from Liberia (42.3%, a difference of 0.14%), Immigrants from Cambodia (42.3%, a difference of 0.16%), and Delaware (42.3%, a difference of 0.19%).
| Demographics | Rating | Rank | Associate's Degree |
| Immigrants | St. Vincent and the Grenadines | 1.9 /100 | #236 | Tragic 42.9% |
| Immigrants | Nonimmigrants | 1.9 /100 | #237 | Tragic 42.9% |
| Iroquois | 1.7 /100 | #238 | Tragic 42.8% |
| Immigrants | Grenada | 1.3 /100 | #239 | Tragic 42.6% |
| Cree | 1.2 /100 | #240 | Tragic 42.5% |
| British West Indians | 1.0 /100 | #241 | Tragic 42.4% |
| Immigrants | West Indies | 1.0 /100 | #242 | Tragic 42.4% |
| Guyanese | 1.0 /100 | #243 | Tragic 42.3% |
| Immigrants | Liberia | 0.9 /100 | #244 | Tragic 42.3% |
| Immigrants | Cambodia | 0.9 /100 | #245 | Tragic 42.3% |
| Delaware | 0.9 /100 | #246 | Tragic 42.3% |
| Immigrants | Fiji | 0.8 /100 | #247 | Tragic 42.2% |
| Immigrants | Ecuador | 0.8 /100 | #248 | Tragic 42.2% |
| Jamaicans | 0.7 /100 | #249 | Tragic 42.1% |
| U.S. Virgin Islanders | 0.7 /100 | #250 | Tragic 42.1% |
Demographics Similar to Immigrants from Israel by Associate's Degree
In terms of associate's degree, the demographic groups most similar to Immigrants from Israel are Cypriot (56.4%, a difference of 0.72%), Thai (57.4%, a difference of 1.1%), Immigrants from Iran (57.7%, a difference of 1.5%), Okinawan (57.7%, a difference of 1.6%), and Immigrants from Australia (55.8%, a difference of 1.8%).
| Demographics | Rating | Rank | Associate's Degree |
| Immigrants | Singapore | 100.0 /100 | #2 | Exceptional 58.9% |
| Immigrants | India | 100.0 /100 | #3 | Exceptional 58.5% |
| Immigrants | Taiwan | 100.0 /100 | #4 | Exceptional 58.4% |
| Iranians | 100.0 /100 | #5 | Exceptional 58.2% |
| Okinawans | 100.0 /100 | #6 | Exceptional 57.7% |
| Immigrants | Iran | 100.0 /100 | #7 | Exceptional 57.7% |
| Thais | 100.0 /100 | #8 | Exceptional 57.4% |
| Immigrants | Israel | 100.0 /100 | #9 | Exceptional 56.8% |
| Cypriots | 100.0 /100 | #10 | Exceptional 56.4% |
| Immigrants | Australia | 100.0 /100 | #11 | Exceptional 55.8% |
| Immigrants | South Central Asia | 100.0 /100 | #12 | Exceptional 55.7% |
| Immigrants | China | 100.0 /100 | #13 | Exceptional 55.5% |
| Immigrants | Hong Kong | 100.0 /100 | #14 | Exceptional 55.4% |
| Immigrants | Eastern Asia | 100.0 /100 | #15 | Exceptional 55.4% |
| Soviet Union | 100.0 /100 | #16 | Exceptional 55.1% |