Ottawa vs Immigrants from Nepal Associate's Degree
COMPARE
Ottawa
Immigrants from Nepal
Associate's Degree
Associate's Degree Comparison
Ottawa
Immigrants from Nepal
40.3%
ASSOCIATE'S DEGREE
0.1/ 100
METRIC RATING
278th/ 347
METRIC RANK
49.5%
ASSOCIATE'S DEGREE
97.5/ 100
METRIC RATING
100th/ 347
METRIC RANK
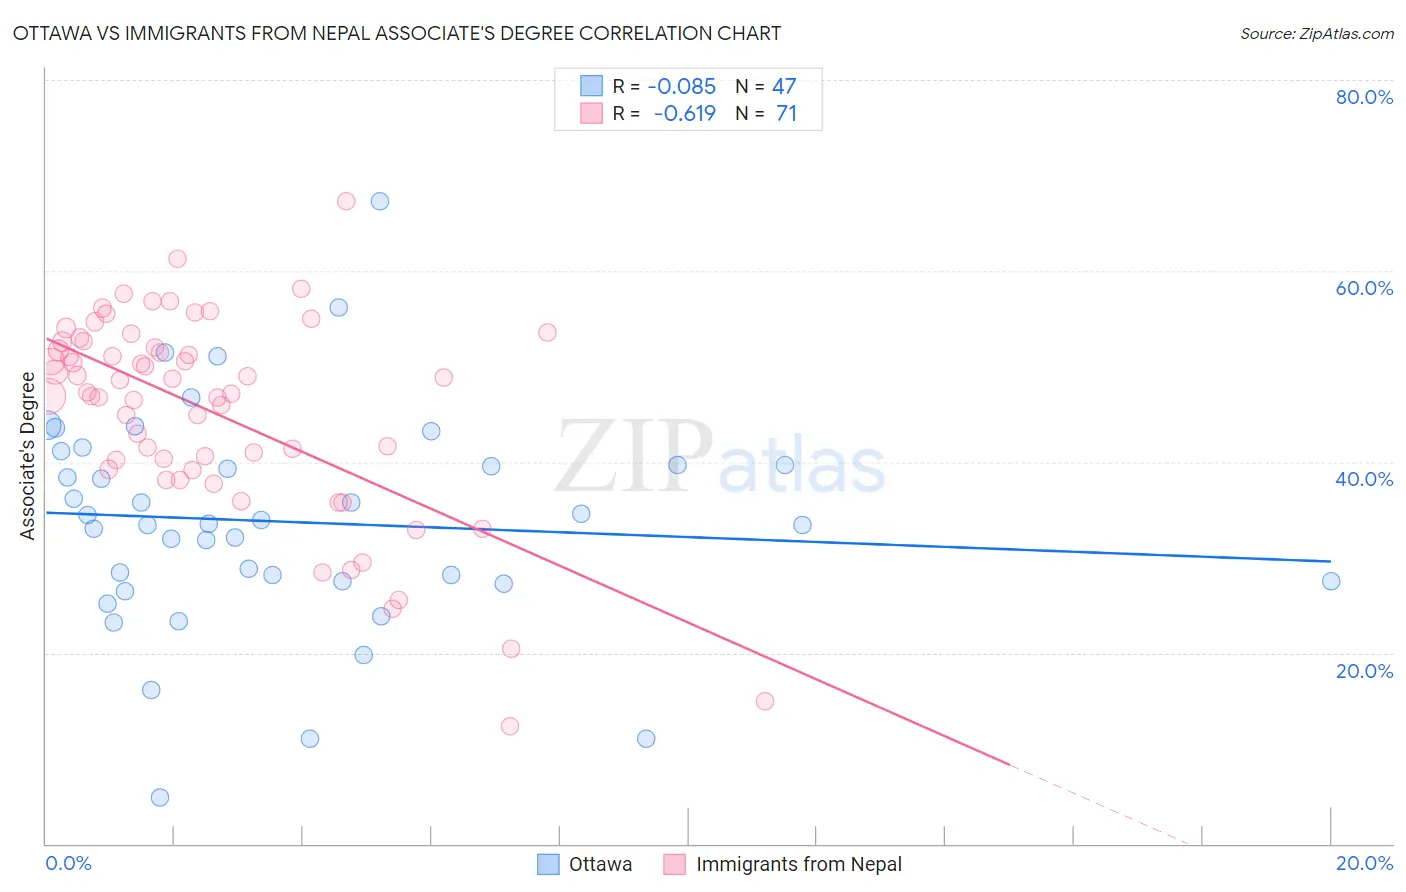
Ottawa vs Immigrants from Nepal Associate's Degree Correlation Chart
The statistical analysis conducted on geographies consisting of 49,956,602 people shows a slight negative correlation between the proportion of Ottawa and percentage of population with at least associate's degree education in the United States with a correlation coefficient (R) of -0.085 and weighted average of 40.3%. Similarly, the statistical analysis conducted on geographies consisting of 186,769,874 people shows a significant negative correlation between the proportion of Immigrants from Nepal and percentage of population with at least associate's degree education in the United States with a correlation coefficient (R) of -0.619 and weighted average of 49.5%, a difference of 23.0%.
Associate's Degree Correlation Summary
| Measurement | Ottawa | Immigrants from Nepal |
| Minimum | 4.8% | 12.3% |
| Maximum | 67.2% | 67.3% |
| Range | 62.4% | 55.0% |
| Mean | 33.7% | 45.2% |
| Median | 33.5% | 47.3% |
| Interquartile 25% (IQ1) | 27.5% | 39.2% |
| Interquartile 75% (IQ3) | 39.7% | 52.6% |
| Interquartile Range (IQR) | 12.2% | 13.3% |
| Standard Deviation (Sample) | 11.6% | 10.7% |
| Standard Deviation (Population) | 11.5% | 10.6% |
Similar Demographics by Associate's Degree
Demographics Similar to Ottawa by Associate's Degree
In terms of associate's degree, the demographic groups most similar to Ottawa are Immigrants from Nicaragua (40.3%, a difference of 0.040%), Blackfeet (40.3%, a difference of 0.15%), Puerto Rican (40.4%, a difference of 0.20%), Immigrants from Micronesia (40.2%, a difference of 0.24%), and Potawatomi (40.4%, a difference of 0.30%).
| Demographics | Rating | Rank | Associate's Degree |
| Immigrants | Laos | 0.1 /100 | #271 | Tragic 40.7% |
| Belizeans | 0.1 /100 | #272 | Tragic 40.6% |
| Puget Sound Salish | 0.1 /100 | #273 | Tragic 40.5% |
| Immigrants | Dominica | 0.1 /100 | #274 | Tragic 40.5% |
| Potawatomi | 0.1 /100 | #275 | Tragic 40.4% |
| Puerto Ricans | 0.1 /100 | #276 | Tragic 40.4% |
| Blackfeet | 0.1 /100 | #277 | Tragic 40.3% |
| Ottawa | 0.1 /100 | #278 | Tragic 40.3% |
| Immigrants | Nicaragua | 0.1 /100 | #279 | Tragic 40.3% |
| Immigrants | Micronesia | 0.1 /100 | #280 | Tragic 40.2% |
| Immigrants | Portugal | 0.1 /100 | #281 | Tragic 40.1% |
| Bangladeshis | 0.1 /100 | #282 | Tragic 40.0% |
| Haitians | 0.1 /100 | #283 | Tragic 40.0% |
| Comanche | 0.1 /100 | #284 | Tragic 39.9% |
| Immigrants | Belize | 0.1 /100 | #285 | Tragic 39.9% |
Demographics Similar to Immigrants from Nepal by Associate's Degree
In terms of associate's degree, the demographic groups most similar to Immigrants from Nepal are Northern European (49.5%, a difference of 0.16%), Chilean (49.4%, a difference of 0.19%), Macedonian (49.6%, a difference of 0.22%), Immigrants from Northern Africa (49.7%, a difference of 0.28%), and Ukrainian (49.4%, a difference of 0.29%).
| Demographics | Rating | Rank | Associate's Degree |
| Immigrants | Brazil | 98.5 /100 | #93 | Exceptional 50.0% |
| Laotians | 98.4 /100 | #94 | Exceptional 49.9% |
| Immigrants | England | 98.0 /100 | #95 | Exceptional 49.7% |
| Romanians | 98.0 /100 | #96 | Exceptional 49.7% |
| Immigrants | Ukraine | 98.0 /100 | #97 | Exceptional 49.7% |
| Immigrants | Northern Africa | 97.9 /100 | #98 | Exceptional 49.7% |
| Macedonians | 97.8 /100 | #99 | Exceptional 49.6% |
| Immigrants | Nepal | 97.5 /100 | #100 | Exceptional 49.5% |
| Northern Europeans | 97.3 /100 | #101 | Exceptional 49.5% |
| Chileans | 97.3 /100 | #102 | Exceptional 49.4% |
| Ukrainians | 97.1 /100 | #103 | Exceptional 49.4% |
| Venezuelans | 97.0 /100 | #104 | Exceptional 49.4% |
| Croatians | 96.8 /100 | #105 | Exceptional 49.3% |
| Immigrants | Italy | 96.7 /100 | #106 | Exceptional 49.3% |
| Syrians | 96.7 /100 | #107 | Exceptional 49.3% |