Guyanese vs Immigrants from Nepal In Labor Force | Age 16-19
COMPARE
Guyanese
Immigrants from Nepal
In Labor Force | Age 16-19
In Labor Force | Age 16-19 Comparison
Guyanese
Immigrants from Nepal
27.4%
IN LABOR FORCE | AGE 16-19
0.0/ 100
METRIC RATING
344th/ 347
METRIC RANK
38.3%
IN LABOR FORCE | AGE 16-19
97.8/ 100
METRIC RATING
118th/ 347
METRIC RANK
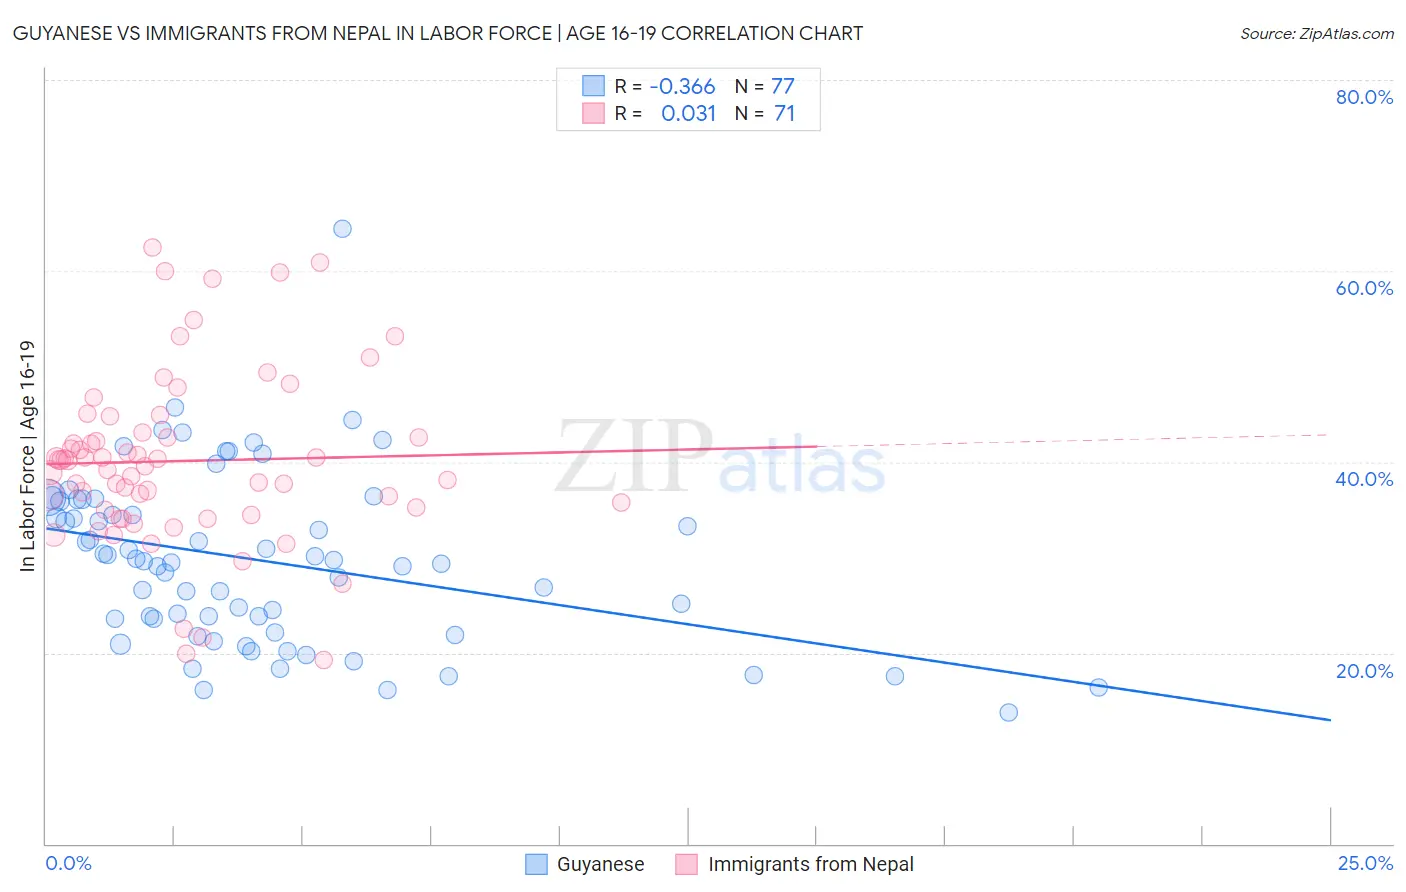
Guyanese vs Immigrants from Nepal In Labor Force | Age 16-19 Correlation Chart
The statistical analysis conducted on geographies consisting of 176,825,360 people shows a mild negative correlation between the proportion of Guyanese and labor force participation rate among population between the ages 16 and 19 in the United States with a correlation coefficient (R) of -0.366 and weighted average of 27.4%. Similarly, the statistical analysis conducted on geographies consisting of 186,763,001 people shows no correlation between the proportion of Immigrants from Nepal and labor force participation rate among population between the ages 16 and 19 in the United States with a correlation coefficient (R) of 0.031 and weighted average of 38.3%, a difference of 39.6%.
In Labor Force | Age 16-19 Correlation Summary
| Measurement | Guyanese | Immigrants from Nepal |
| Minimum | 13.7% | 19.2% |
| Maximum | 64.4% | 62.5% |
| Range | 50.7% | 43.3% |
| Mean | 29.6% | 40.1% |
| Median | 29.6% | 40.1% |
| Interquartile 25% (IQ1) | 22.9% | 35.0% |
| Interquartile 75% (IQ3) | 36.0% | 43.1% |
| Interquartile Range (IQR) | 13.1% | 8.1% |
| Standard Deviation (Sample) | 9.0% | 9.0% |
| Standard Deviation (Population) | 8.9% | 9.0% |
Similar Demographics by In Labor Force | Age 16-19
Demographics Similar to Guyanese by In Labor Force | Age 16-19
In terms of in labor force | age 16-19, the demographic groups most similar to Guyanese are Immigrants from Guyana (27.3%, a difference of 0.66%), Yuman (27.7%, a difference of 0.76%), Immigrants from St. Vincent and the Grenadines (26.3%, a difference of 4.5%), Immigrants from Barbados (29.0%, a difference of 5.6%), and Immigrants from Armenia (29.0%, a difference of 5.8%).
| Demographics | Rating | Rank | In Labor Force | Age 16-19 |
| Immigrants | Hong Kong | 0.0 /100 | #333 | Tragic 30.5% |
| Puerto Ricans | 0.0 /100 | #334 | Tragic 30.3% |
| Immigrants | Cuba | 0.0 /100 | #335 | Tragic 30.2% |
| Immigrants | Trinidad and Tobago | 0.0 /100 | #336 | Tragic 30.2% |
| Immigrants | Bangladesh | 0.0 /100 | #337 | Tragic 30.0% |
| Vietnamese | 0.0 /100 | #338 | Tragic 29.6% |
| Immigrants | Uzbekistan | 0.0 /100 | #339 | Tragic 29.2% |
| British West Indians | 0.0 /100 | #340 | Tragic 29.1% |
| Immigrants | Armenia | 0.0 /100 | #341 | Tragic 29.0% |
| Immigrants | Barbados | 0.0 /100 | #342 | Tragic 29.0% |
| Yuman | 0.0 /100 | #343 | Tragic 27.7% |
| Guyanese | 0.0 /100 | #344 | Tragic 27.4% |
| Immigrants | Guyana | 0.0 /100 | #345 | Tragic 27.3% |
| Immigrants | St. Vincent and the Grenadines | 0.0 /100 | #346 | Tragic 26.3% |
| Immigrants | Grenada | 0.0 /100 | #347 | Tragic 25.4% |
Demographics Similar to Immigrants from Nepal by In Labor Force | Age 16-19
In terms of in labor force | age 16-19, the demographic groups most similar to Immigrants from Nepal are Chickasaw (38.3%, a difference of 0.010%), Assyrian/Chaldean/Syriac (38.3%, a difference of 0.020%), Colville (38.3%, a difference of 0.060%), Bulgarian (38.3%, a difference of 0.070%), and Ukrainian (38.3%, a difference of 0.10%).
| Demographics | Rating | Rank | In Labor Force | Age 16-19 |
| Crow | 98.5 /100 | #111 | Exceptional 38.5% |
| Immigrants | Scotland | 98.5 /100 | #112 | Exceptional 38.5% |
| Sub-Saharan Africans | 98.3 /100 | #113 | Exceptional 38.4% |
| Hawaiians | 98.2 /100 | #114 | Exceptional 38.4% |
| Bulgarians | 97.9 /100 | #115 | Exceptional 38.3% |
| Colville | 97.9 /100 | #116 | Exceptional 38.3% |
| Chickasaw | 97.8 /100 | #117 | Exceptional 38.3% |
| Immigrants | Nepal | 97.8 /100 | #118 | Exceptional 38.3% |
| Assyrians/Chaldeans/Syriacs | 97.8 /100 | #119 | Exceptional 38.3% |
| Ukrainians | 97.6 /100 | #120 | Exceptional 38.3% |
| Ethiopians | 97.4 /100 | #121 | Exceptional 38.2% |
| Guamanians/Chamorros | 97.4 /100 | #122 | Exceptional 38.2% |
| Seminole | 96.7 /100 | #123 | Exceptional 38.1% |
| Immigrants | England | 96.4 /100 | #124 | Exceptional 38.1% |
| Immigrants | Africa | 96.1 /100 | #125 | Exceptional 38.0% |