Guyanese vs Bahamian Associate's Degree
COMPARE
Guyanese
Bahamian
Associate's Degree
Associate's Degree Comparison
Guyanese
Bahamians
42.3%
ASSOCIATE'S DEGREE
1.0/ 100
METRIC RATING
243rd/ 347
METRIC RANK
41.5%
ASSOCIATE'S DEGREE
0.4/ 100
METRIC RATING
262nd/ 347
METRIC RANK
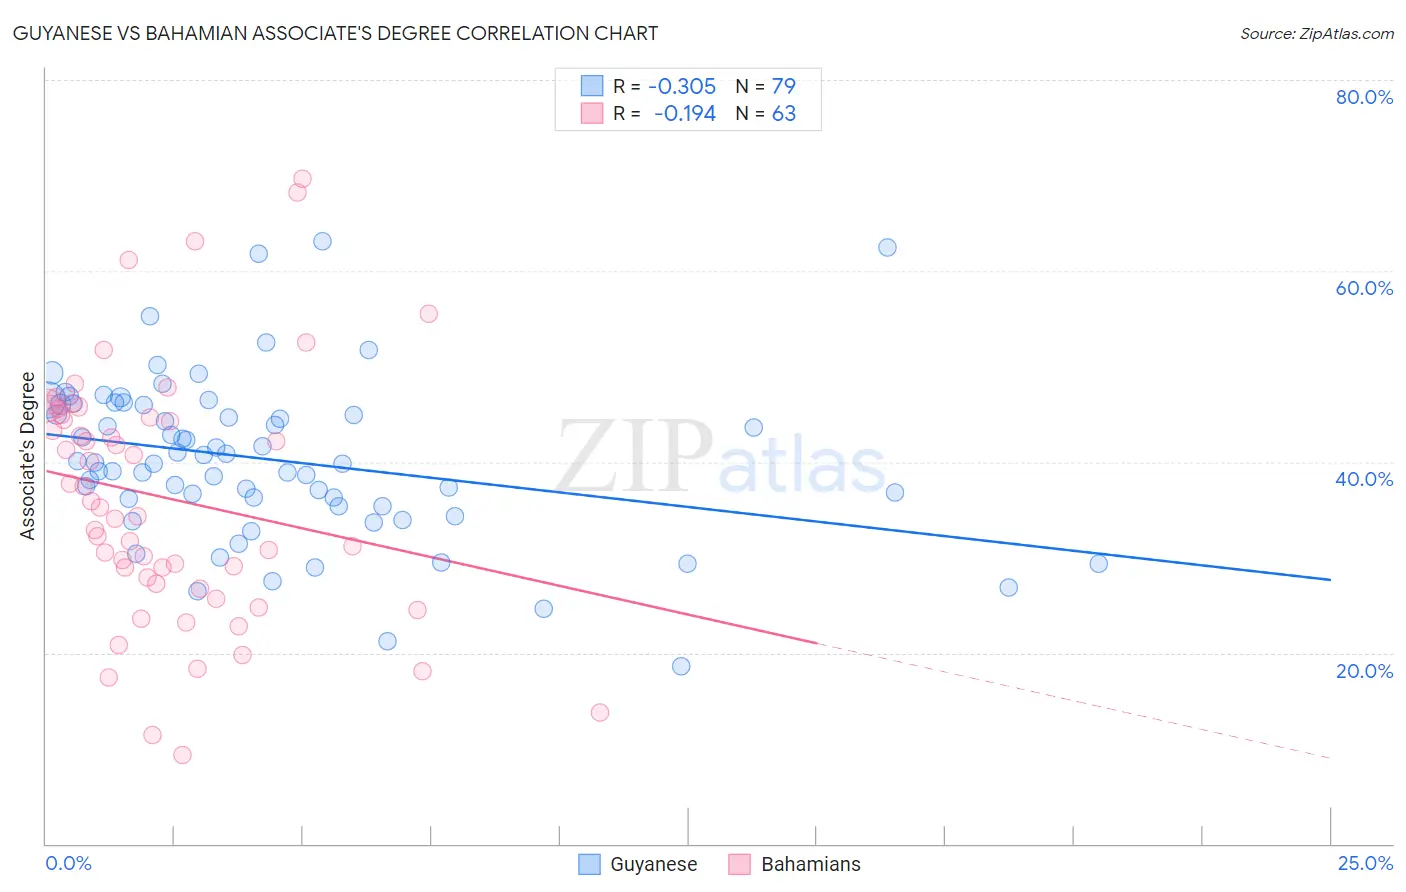
Guyanese vs Bahamian Associate's Degree Correlation Chart
The statistical analysis conducted on geographies consisting of 176,923,835 people shows a mild negative correlation between the proportion of Guyanese and percentage of population with at least associate's degree education in the United States with a correlation coefficient (R) of -0.305 and weighted average of 42.3%. Similarly, the statistical analysis conducted on geographies consisting of 112,704,799 people shows a poor negative correlation between the proportion of Bahamians and percentage of population with at least associate's degree education in the United States with a correlation coefficient (R) of -0.194 and weighted average of 41.5%, a difference of 2.1%.
Associate's Degree Correlation Summary
| Measurement | Guyanese | Bahamian |
| Minimum | 18.6% | 9.3% |
| Maximum | 63.1% | 69.7% |
| Range | 44.5% | 60.4% |
| Mean | 40.2% | 36.3% |
| Median | 39.9% | 35.2% |
| Interquartile 25% (IQ1) | 35.4% | 27.3% |
| Interquartile 75% (IQ3) | 46.0% | 45.0% |
| Interquartile Range (IQR) | 10.6% | 17.7% |
| Standard Deviation (Sample) | 8.5% | 13.1% |
| Standard Deviation (Population) | 8.5% | 13.0% |
Demographics Similar to Guyanese and Bahamians by Associate's Degree
In terms of associate's degree, the demographic groups most similar to Guyanese are Immigrants from West Indies (42.4%, a difference of 0.11%), Immigrants from Liberia (42.3%, a difference of 0.14%), Immigrants from Cambodia (42.3%, a difference of 0.16%), Delaware (42.3%, a difference of 0.19%), and Immigrants from Fiji (42.2%, a difference of 0.28%). Similarly, the demographic groups most similar to Bahamians are Nicaraguan (41.5%, a difference of 0.090%), Marshallese (41.6%, a difference of 0.22%), Malaysian (41.6%, a difference of 0.41%), Japanese (41.7%, a difference of 0.51%), and Spanish American (41.8%, a difference of 0.73%).
| Demographics | Rating | Rank | Associate's Degree |
| Immigrants | West Indies | 1.0 /100 | #242 | Tragic 42.4% |
| Guyanese | 1.0 /100 | #243 | Tragic 42.3% |
| Immigrants | Liberia | 0.9 /100 | #244 | Tragic 42.3% |
| Immigrants | Cambodia | 0.9 /100 | #245 | Tragic 42.3% |
| Delaware | 0.9 /100 | #246 | Tragic 42.3% |
| Immigrants | Fiji | 0.8 /100 | #247 | Tragic 42.2% |
| Immigrants | Ecuador | 0.8 /100 | #248 | Tragic 42.2% |
| Jamaicans | 0.7 /100 | #249 | Tragic 42.1% |
| U.S. Virgin Islanders | 0.7 /100 | #250 | Tragic 42.1% |
| Immigrants | Bahamas | 0.7 /100 | #251 | Tragic 42.1% |
| French American Indians | 0.6 /100 | #252 | Tragic 42.0% |
| Indonesians | 0.6 /100 | #253 | Tragic 41.9% |
| Cubans | 0.6 /100 | #254 | Tragic 41.9% |
| Immigrants | Guyana | 0.5 /100 | #255 | Tragic 41.8% |
| Immigrants | Congo | 0.5 /100 | #256 | Tragic 41.8% |
| Spanish Americans | 0.5 /100 | #257 | Tragic 41.8% |
| Japanese | 0.5 /100 | #258 | Tragic 41.7% |
| Malaysians | 0.4 /100 | #259 | Tragic 41.6% |
| Marshallese | 0.4 /100 | #260 | Tragic 41.6% |
| Nicaraguans | 0.4 /100 | #261 | Tragic 41.5% |
| Bahamians | 0.4 /100 | #262 | Tragic 41.5% |