Guyanese vs Immigrants from Zimbabwe Associate's Degree
COMPARE
Guyanese
Immigrants from Zimbabwe
Associate's Degree
Associate's Degree Comparison
Guyanese
Immigrants from Zimbabwe
42.3%
ASSOCIATE'S DEGREE
1.0/ 100
METRIC RATING
243rd/ 347
METRIC RANK
50.5%
ASSOCIATE'S DEGREE
99.2/ 100
METRIC RATING
76th/ 347
METRIC RANK
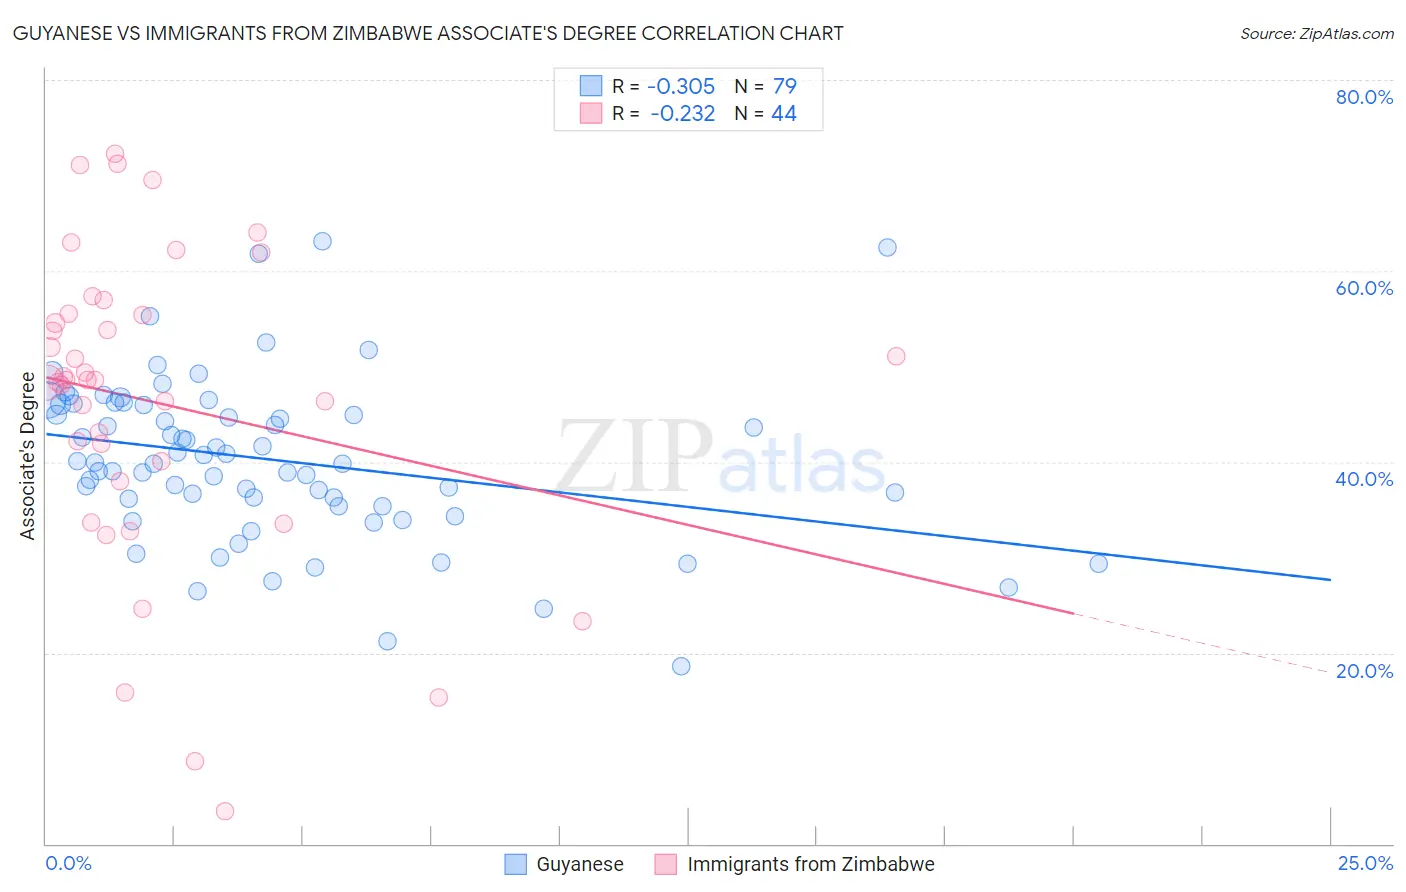
Guyanese vs Immigrants from Zimbabwe Associate's Degree Correlation Chart
The statistical analysis conducted on geographies consisting of 176,923,835 people shows a mild negative correlation between the proportion of Guyanese and percentage of population with at least associate's degree education in the United States with a correlation coefficient (R) of -0.305 and weighted average of 42.3%. Similarly, the statistical analysis conducted on geographies consisting of 117,809,864 people shows a weak negative correlation between the proportion of Immigrants from Zimbabwe and percentage of population with at least associate's degree education in the United States with a correlation coefficient (R) of -0.232 and weighted average of 50.5%, a difference of 19.3%.
Associate's Degree Correlation Summary
| Measurement | Guyanese | Immigrants from Zimbabwe |
| Minimum | 18.6% | 3.5% |
| Maximum | 63.1% | 72.3% |
| Range | 44.5% | 68.9% |
| Mean | 40.2% | 46.2% |
| Median | 39.9% | 48.6% |
| Interquartile 25% (IQ1) | 35.4% | 39.0% |
| Interquartile 75% (IQ3) | 46.0% | 55.5% |
| Interquartile Range (IQR) | 10.6% | 16.4% |
| Standard Deviation (Sample) | 8.5% | 16.2% |
| Standard Deviation (Population) | 8.5% | 16.0% |
Similar Demographics by Associate's Degree
Demographics Similar to Guyanese by Associate's Degree
In terms of associate's degree, the demographic groups most similar to Guyanese are Immigrants from West Indies (42.4%, a difference of 0.11%), British West Indian (42.4%, a difference of 0.12%), Immigrants from Liberia (42.3%, a difference of 0.14%), Immigrants from Cambodia (42.3%, a difference of 0.16%), and Delaware (42.3%, a difference of 0.19%).
| Demographics | Rating | Rank | Associate's Degree |
| Immigrants | St. Vincent and the Grenadines | 1.9 /100 | #236 | Tragic 42.9% |
| Immigrants | Nonimmigrants | 1.9 /100 | #237 | Tragic 42.9% |
| Iroquois | 1.7 /100 | #238 | Tragic 42.8% |
| Immigrants | Grenada | 1.3 /100 | #239 | Tragic 42.6% |
| Cree | 1.2 /100 | #240 | Tragic 42.5% |
| British West Indians | 1.0 /100 | #241 | Tragic 42.4% |
| Immigrants | West Indies | 1.0 /100 | #242 | Tragic 42.4% |
| Guyanese | 1.0 /100 | #243 | Tragic 42.3% |
| Immigrants | Liberia | 0.9 /100 | #244 | Tragic 42.3% |
| Immigrants | Cambodia | 0.9 /100 | #245 | Tragic 42.3% |
| Delaware | 0.9 /100 | #246 | Tragic 42.3% |
| Immigrants | Fiji | 0.8 /100 | #247 | Tragic 42.2% |
| Immigrants | Ecuador | 0.8 /100 | #248 | Tragic 42.2% |
| Jamaicans | 0.7 /100 | #249 | Tragic 42.1% |
| U.S. Virgin Islanders | 0.7 /100 | #250 | Tragic 42.1% |
Demographics Similar to Immigrants from Zimbabwe by Associate's Degree
In terms of associate's degree, the demographic groups most similar to Immigrants from Zimbabwe are Immigrants from Lebanon (50.5%, a difference of 0.030%), Immigrants from Eastern Europe (50.5%, a difference of 0.080%), Ethiopian (50.4%, a difference of 0.090%), Armenian (50.4%, a difference of 0.12%), and Maltese (50.4%, a difference of 0.19%).
| Demographics | Rating | Rank | Associate's Degree |
| Egyptians | 99.5 /100 | #69 | Exceptional 50.9% |
| Immigrants | Argentina | 99.5 /100 | #70 | Exceptional 50.9% |
| Immigrants | Romania | 99.5 /100 | #71 | Exceptional 50.9% |
| Immigrants | Pakistan | 99.5 /100 | #72 | Exceptional 50.9% |
| Carpatho Rusyns | 99.3 /100 | #73 | Exceptional 50.6% |
| Lithuanians | 99.3 /100 | #74 | Exceptional 50.6% |
| Immigrants | Scotland | 99.3 /100 | #75 | Exceptional 50.6% |
| Immigrants | Zimbabwe | 99.2 /100 | #76 | Exceptional 50.5% |
| Immigrants | Lebanon | 99.1 /100 | #77 | Exceptional 50.5% |
| Immigrants | Eastern Europe | 99.1 /100 | #78 | Exceptional 50.5% |
| Ethiopians | 99.1 /100 | #79 | Exceptional 50.4% |
| Armenians | 99.1 /100 | #80 | Exceptional 50.4% |
| Maltese | 99.1 /100 | #81 | Exceptional 50.4% |
| Greeks | 98.9 /100 | #82 | Exceptional 50.3% |
| Immigrants | Uzbekistan | 98.9 /100 | #83 | Exceptional 50.3% |