Guyanese vs Portuguese Associate's Degree
COMPARE
Guyanese
Portuguese
Associate's Degree
Associate's Degree Comparison
Guyanese
Portuguese
42.3%
ASSOCIATE'S DEGREE
1.0/ 100
METRIC RATING
243rd/ 347
METRIC RANK
44.1%
ASSOCIATE'S DEGREE
7.2/ 100
METRIC RATING
220th/ 347
METRIC RANK
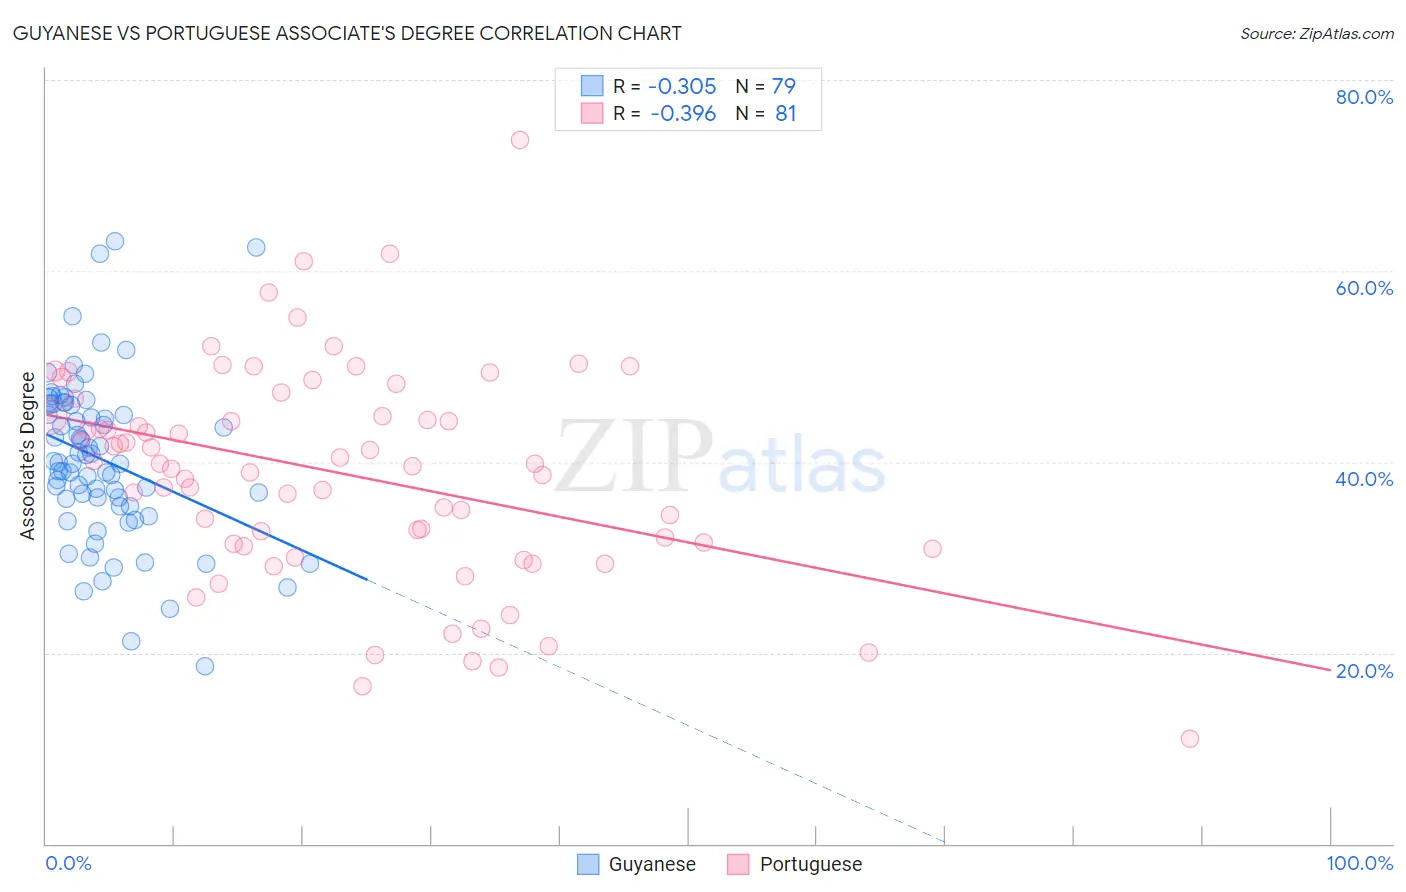
Guyanese vs Portuguese Associate's Degree Correlation Chart
The statistical analysis conducted on geographies consisting of 176,923,835 people shows a mild negative correlation between the proportion of Guyanese and percentage of population with at least associate's degree education in the United States with a correlation coefficient (R) of -0.305 and weighted average of 42.3%. Similarly, the statistical analysis conducted on geographies consisting of 450,325,825 people shows a mild negative correlation between the proportion of Portuguese and percentage of population with at least associate's degree education in the United States with a correlation coefficient (R) of -0.396 and weighted average of 44.1%, a difference of 4.3%.
Associate's Degree Correlation Summary
| Measurement | Guyanese | Portuguese |
| Minimum | 18.6% | 11.0% |
| Maximum | 63.1% | 73.7% |
| Range | 44.5% | 62.7% |
| Mean | 40.2% | 38.8% |
| Median | 39.9% | 39.8% |
| Interquartile 25% (IQ1) | 35.4% | 31.3% |
| Interquartile 75% (IQ3) | 46.0% | 45.7% |
| Interquartile Range (IQR) | 10.6% | 14.4% |
| Standard Deviation (Sample) | 8.5% | 11.3% |
| Standard Deviation (Population) | 8.5% | 11.2% |
Similar Demographics by Associate's Degree
Demographics Similar to Guyanese by Associate's Degree
In terms of associate's degree, the demographic groups most similar to Guyanese are Immigrants from West Indies (42.4%, a difference of 0.11%), British West Indian (42.4%, a difference of 0.12%), Immigrants from Liberia (42.3%, a difference of 0.14%), Immigrants from Cambodia (42.3%, a difference of 0.16%), and Delaware (42.3%, a difference of 0.19%).
| Demographics | Rating | Rank | Associate's Degree |
| Immigrants | St. Vincent and the Grenadines | 1.9 /100 | #236 | Tragic 42.9% |
| Immigrants | Nonimmigrants | 1.9 /100 | #237 | Tragic 42.9% |
| Iroquois | 1.7 /100 | #238 | Tragic 42.8% |
| Immigrants | Grenada | 1.3 /100 | #239 | Tragic 42.6% |
| Cree | 1.2 /100 | #240 | Tragic 42.5% |
| British West Indians | 1.0 /100 | #241 | Tragic 42.4% |
| Immigrants | West Indies | 1.0 /100 | #242 | Tragic 42.4% |
| Guyanese | 1.0 /100 | #243 | Tragic 42.3% |
| Immigrants | Liberia | 0.9 /100 | #244 | Tragic 42.3% |
| Immigrants | Cambodia | 0.9 /100 | #245 | Tragic 42.3% |
| Delaware | 0.9 /100 | #246 | Tragic 42.3% |
| Immigrants | Fiji | 0.8 /100 | #247 | Tragic 42.2% |
| Immigrants | Ecuador | 0.8 /100 | #248 | Tragic 42.2% |
| Jamaicans | 0.7 /100 | #249 | Tragic 42.1% |
| U.S. Virgin Islanders | 0.7 /100 | #250 | Tragic 42.1% |
Demographics Similar to Portuguese by Associate's Degree
In terms of associate's degree, the demographic groups most similar to Portuguese are White/Caucasian (44.2%, a difference of 0.070%), Immigrants from Western Africa (44.1%, a difference of 0.20%), Barbadian (43.9%, a difference of 0.47%), Spanish (44.4%, a difference of 0.55%), and Subsaharan African (43.9%, a difference of 0.57%).
| Demographics | Rating | Rank | Associate's Degree |
| Immigrants | Ghana | 14.2 /100 | #213 | Poor 44.8% |
| Immigrants | Middle Africa | 12.7 /100 | #214 | Poor 44.7% |
| Immigrants | Panama | 12.4 /100 | #215 | Poor 44.7% |
| Immigrants | Nigeria | 11.4 /100 | #216 | Poor 44.6% |
| Immigrants | Immigrants | 10.5 /100 | #217 | Poor 44.5% |
| Spanish | 9.4 /100 | #218 | Tragic 44.4% |
| Whites/Caucasians | 7.5 /100 | #219 | Tragic 44.2% |
| Portuguese | 7.2 /100 | #220 | Tragic 44.1% |
| Immigrants | Western Africa | 6.6 /100 | #221 | Tragic 44.1% |
| Barbadians | 5.8 /100 | #222 | Tragic 43.9% |
| Sub-Saharan Africans | 5.5 /100 | #223 | Tragic 43.9% |
| West Indians | 5.2 /100 | #224 | Tragic 43.8% |
| Guamanians/Chamorros | 4.8 /100 | #225 | Tragic 43.8% |
| Immigrants | Burma/Myanmar | 4.3 /100 | #226 | Tragic 43.7% |
| Trinidadians and Tobagonians | 4.0 /100 | #227 | Tragic 43.6% |