Guyanese vs Immigrants from Latvia Associate's Degree
COMPARE
Guyanese
Immigrants from Latvia
Associate's Degree
Associate's Degree Comparison
Guyanese
Immigrants from Latvia
42.3%
ASSOCIATE'S DEGREE
1.0/ 100
METRIC RATING
243rd/ 347
METRIC RANK
52.8%
ASSOCIATE'S DEGREE
99.9/ 100
METRIC RATING
40th/ 347
METRIC RANK
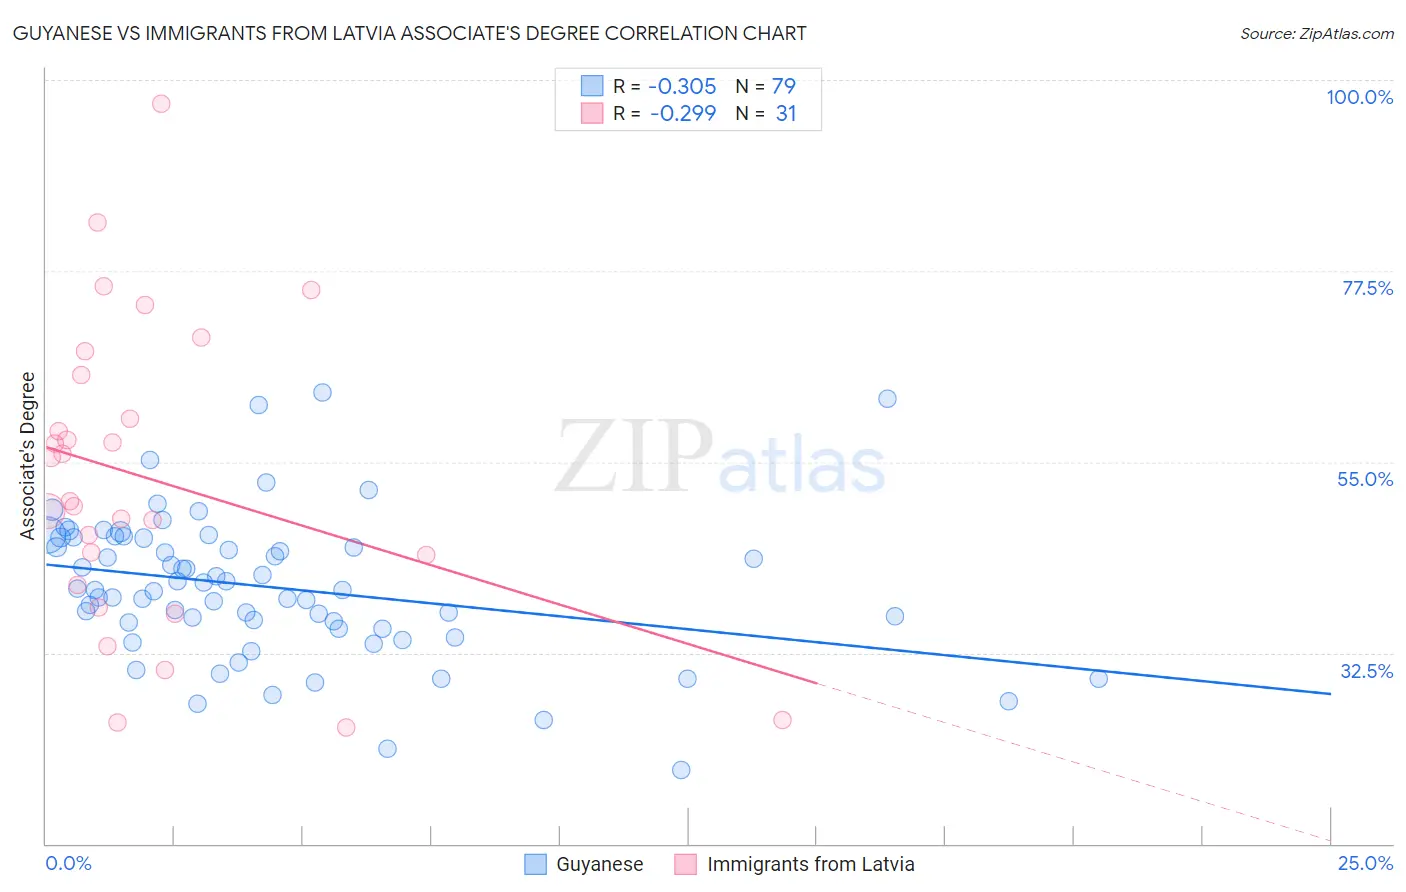
Guyanese vs Immigrants from Latvia Associate's Degree Correlation Chart
The statistical analysis conducted on geographies consisting of 176,923,835 people shows a mild negative correlation between the proportion of Guyanese and percentage of population with at least associate's degree education in the United States with a correlation coefficient (R) of -0.305 and weighted average of 42.3%. Similarly, the statistical analysis conducted on geographies consisting of 113,735,345 people shows a weak negative correlation between the proportion of Immigrants from Latvia and percentage of population with at least associate's degree education in the United States with a correlation coefficient (R) of -0.299 and weighted average of 52.8%, a difference of 24.7%.
Associate's Degree Correlation Summary
| Measurement | Guyanese | Immigrants from Latvia |
| Minimum | 18.6% | 23.7% |
| Maximum | 63.1% | 97.2% |
| Range | 44.5% | 73.5% |
| Mean | 40.2% | 53.0% |
| Median | 39.9% | 50.3% |
| Interquartile 25% (IQ1) | 35.4% | 40.4% |
| Interquartile 75% (IQ3) | 46.0% | 65.2% |
| Interquartile Range (IQR) | 10.6% | 24.8% |
| Standard Deviation (Sample) | 8.5% | 17.7% |
| Standard Deviation (Population) | 8.5% | 17.4% |
Similar Demographics by Associate's Degree
Demographics Similar to Guyanese by Associate's Degree
In terms of associate's degree, the demographic groups most similar to Guyanese are Immigrants from West Indies (42.4%, a difference of 0.11%), British West Indian (42.4%, a difference of 0.12%), Immigrants from Liberia (42.3%, a difference of 0.14%), Immigrants from Cambodia (42.3%, a difference of 0.16%), and Delaware (42.3%, a difference of 0.19%).
| Demographics | Rating | Rank | Associate's Degree |
| Immigrants | St. Vincent and the Grenadines | 1.9 /100 | #236 | Tragic 42.9% |
| Immigrants | Nonimmigrants | 1.9 /100 | #237 | Tragic 42.9% |
| Iroquois | 1.7 /100 | #238 | Tragic 42.8% |
| Immigrants | Grenada | 1.3 /100 | #239 | Tragic 42.6% |
| Cree | 1.2 /100 | #240 | Tragic 42.5% |
| British West Indians | 1.0 /100 | #241 | Tragic 42.4% |
| Immigrants | West Indies | 1.0 /100 | #242 | Tragic 42.4% |
| Guyanese | 1.0 /100 | #243 | Tragic 42.3% |
| Immigrants | Liberia | 0.9 /100 | #244 | Tragic 42.3% |
| Immigrants | Cambodia | 0.9 /100 | #245 | Tragic 42.3% |
| Delaware | 0.9 /100 | #246 | Tragic 42.3% |
| Immigrants | Fiji | 0.8 /100 | #247 | Tragic 42.2% |
| Immigrants | Ecuador | 0.8 /100 | #248 | Tragic 42.2% |
| Jamaicans | 0.7 /100 | #249 | Tragic 42.1% |
| U.S. Virgin Islanders | 0.7 /100 | #250 | Tragic 42.1% |
Demographics Similar to Immigrants from Latvia by Associate's Degree
In terms of associate's degree, the demographic groups most similar to Immigrants from Latvia are Immigrants from Belarus (52.8%, a difference of 0.070%), Mongolian (53.0%, a difference of 0.36%), Immigrants from Saudi Arabia (52.6%, a difference of 0.43%), Immigrants from Malaysia (52.5%, a difference of 0.46%), and Immigrants from South Africa (52.5%, a difference of 0.47%).
| Demographics | Rating | Rank | Associate's Degree |
| Israelis | 100.0 /100 | #33 | Exceptional 53.4% |
| Bulgarians | 100.0 /100 | #34 | Exceptional 53.3% |
| Russians | 100.0 /100 | #35 | Exceptional 53.2% |
| Immigrants | Russia | 100.0 /100 | #36 | Exceptional 53.1% |
| Immigrants | Denmark | 100.0 /100 | #37 | Exceptional 53.1% |
| Mongolians | 100.0 /100 | #38 | Exceptional 53.0% |
| Immigrants | Belarus | 99.9 /100 | #39 | Exceptional 52.8% |
| Immigrants | Latvia | 99.9 /100 | #40 | Exceptional 52.8% |
| Immigrants | Saudi Arabia | 99.9 /100 | #41 | Exceptional 52.6% |
| Immigrants | Malaysia | 99.9 /100 | #42 | Exceptional 52.5% |
| Immigrants | South Africa | 99.9 /100 | #43 | Exceptional 52.5% |
| Estonians | 99.9 /100 | #44 | Exceptional 52.5% |
| Immigrants | Lithuania | 99.9 /100 | #45 | Exceptional 52.4% |
| Immigrants | Bulgaria | 99.9 /100 | #46 | Exceptional 52.4% |
| Immigrants | Kuwait | 99.9 /100 | #47 | Exceptional 52.4% |