Ugandan vs Immigrants from Latvia Associate's Degree
COMPARE
Ugandan
Immigrants from Latvia
Associate's Degree
Associate's Degree Comparison
Ugandans
Immigrants from Latvia
48.7%
ASSOCIATE'S DEGREE
93.9/ 100
METRIC RATING
121st/ 347
METRIC RANK
52.8%
ASSOCIATE'S DEGREE
99.9/ 100
METRIC RATING
40th/ 347
METRIC RANK
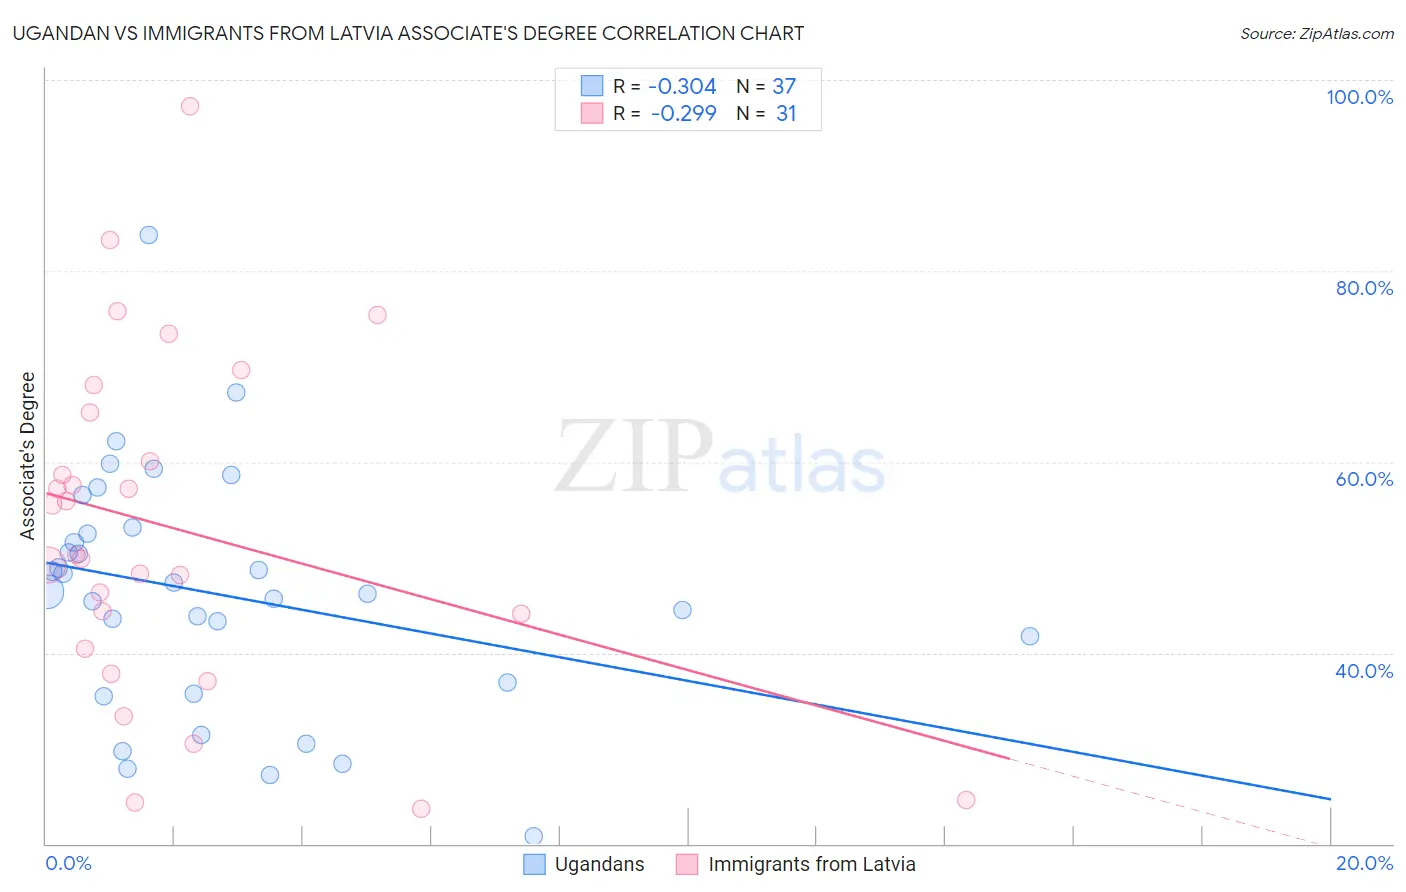
Ugandan vs Immigrants from Latvia Associate's Degree Correlation Chart
The statistical analysis conducted on geographies consisting of 94,018,576 people shows a mild negative correlation between the proportion of Ugandans and percentage of population with at least associate's degree education in the United States with a correlation coefficient (R) of -0.304 and weighted average of 48.7%. Similarly, the statistical analysis conducted on geographies consisting of 113,735,345 people shows a weak negative correlation between the proportion of Immigrants from Latvia and percentage of population with at least associate's degree education in the United States with a correlation coefficient (R) of -0.299 and weighted average of 52.8%, a difference of 8.3%.
Associate's Degree Correlation Summary
| Measurement | Ugandan | Immigrants from Latvia |
| Minimum | 20.8% | 23.7% |
| Maximum | 83.8% | 97.2% |
| Range | 63.0% | 73.5% |
| Mean | 46.2% | 53.0% |
| Median | 46.4% | 50.3% |
| Interquartile 25% (IQ1) | 36.3% | 40.4% |
| Interquartile 75% (IQ3) | 52.8% | 65.2% |
| Interquartile Range (IQR) | 16.5% | 24.8% |
| Standard Deviation (Sample) | 12.7% | 17.7% |
| Standard Deviation (Population) | 12.5% | 17.4% |
Similar Demographics by Associate's Degree
Demographics Similar to Ugandans by Associate's Degree
In terms of associate's degree, the demographic groups most similar to Ugandans are Italian (48.7%, a difference of 0.0%), Brazilian (48.7%, a difference of 0.070%), Alsatian (48.8%, a difference of 0.23%), Lebanese (48.8%, a difference of 0.25%), and Albanian (48.8%, a difference of 0.26%).
| Demographics | Rating | Rank | Associate's Degree |
| Arabs | 95.3 /100 | #114 | Exceptional 49.0% |
| Luxembourgers | 95.1 /100 | #115 | Exceptional 48.9% |
| British | 95.0 /100 | #116 | Exceptional 48.9% |
| Afghans | 94.8 /100 | #117 | Exceptional 48.9% |
| Albanians | 94.7 /100 | #118 | Exceptional 48.8% |
| Lebanese | 94.6 /100 | #119 | Exceptional 48.8% |
| Alsatians | 94.6 /100 | #120 | Exceptional 48.8% |
| Ugandans | 93.9 /100 | #121 | Exceptional 48.7% |
| Italians | 93.9 /100 | #122 | Exceptional 48.7% |
| Brazilians | 93.7 /100 | #123 | Exceptional 48.7% |
| Serbians | 92.6 /100 | #124 | Exceptional 48.5% |
| Chinese | 92.5 /100 | #125 | Exceptional 48.5% |
| Immigrants | Syria | 92.2 /100 | #126 | Exceptional 48.5% |
| Immigrants | Uganda | 92.1 /100 | #127 | Exceptional 48.5% |
| Immigrants | Eastern Africa | 91.6 /100 | #128 | Exceptional 48.4% |
Demographics Similar to Immigrants from Latvia by Associate's Degree
In terms of associate's degree, the demographic groups most similar to Immigrants from Latvia are Immigrants from Belarus (52.8%, a difference of 0.070%), Mongolian (53.0%, a difference of 0.36%), Immigrants from Saudi Arabia (52.6%, a difference of 0.43%), Immigrants from Malaysia (52.5%, a difference of 0.46%), and Immigrants from South Africa (52.5%, a difference of 0.47%).
| Demographics | Rating | Rank | Associate's Degree |
| Israelis | 100.0 /100 | #33 | Exceptional 53.4% |
| Bulgarians | 100.0 /100 | #34 | Exceptional 53.3% |
| Russians | 100.0 /100 | #35 | Exceptional 53.2% |
| Immigrants | Russia | 100.0 /100 | #36 | Exceptional 53.1% |
| Immigrants | Denmark | 100.0 /100 | #37 | Exceptional 53.1% |
| Mongolians | 100.0 /100 | #38 | Exceptional 53.0% |
| Immigrants | Belarus | 99.9 /100 | #39 | Exceptional 52.8% |
| Immigrants | Latvia | 99.9 /100 | #40 | Exceptional 52.8% |
| Immigrants | Saudi Arabia | 99.9 /100 | #41 | Exceptional 52.6% |
| Immigrants | Malaysia | 99.9 /100 | #42 | Exceptional 52.5% |
| Immigrants | South Africa | 99.9 /100 | #43 | Exceptional 52.5% |
| Estonians | 99.9 /100 | #44 | Exceptional 52.5% |
| Immigrants | Lithuania | 99.9 /100 | #45 | Exceptional 52.4% |
| Immigrants | Bulgaria | 99.9 /100 | #46 | Exceptional 52.4% |
| Immigrants | Kuwait | 99.9 /100 | #47 | Exceptional 52.4% |