Guyanese vs Immigrants from Ghana College, Under 1 year
COMPARE
Guyanese
Immigrants from Ghana
College, Under 1 year
College, Under 1 year Comparison
Guyanese
Immigrants from Ghana
59.0%
COLLEGE, UNDER 1 YEAR
0.0/ 100
METRIC RATING
297th/ 347
METRIC RANK
63.1%
COLLEGE, UNDER 1 YEAR
3.7/ 100
METRIC RATING
227th/ 347
METRIC RANK
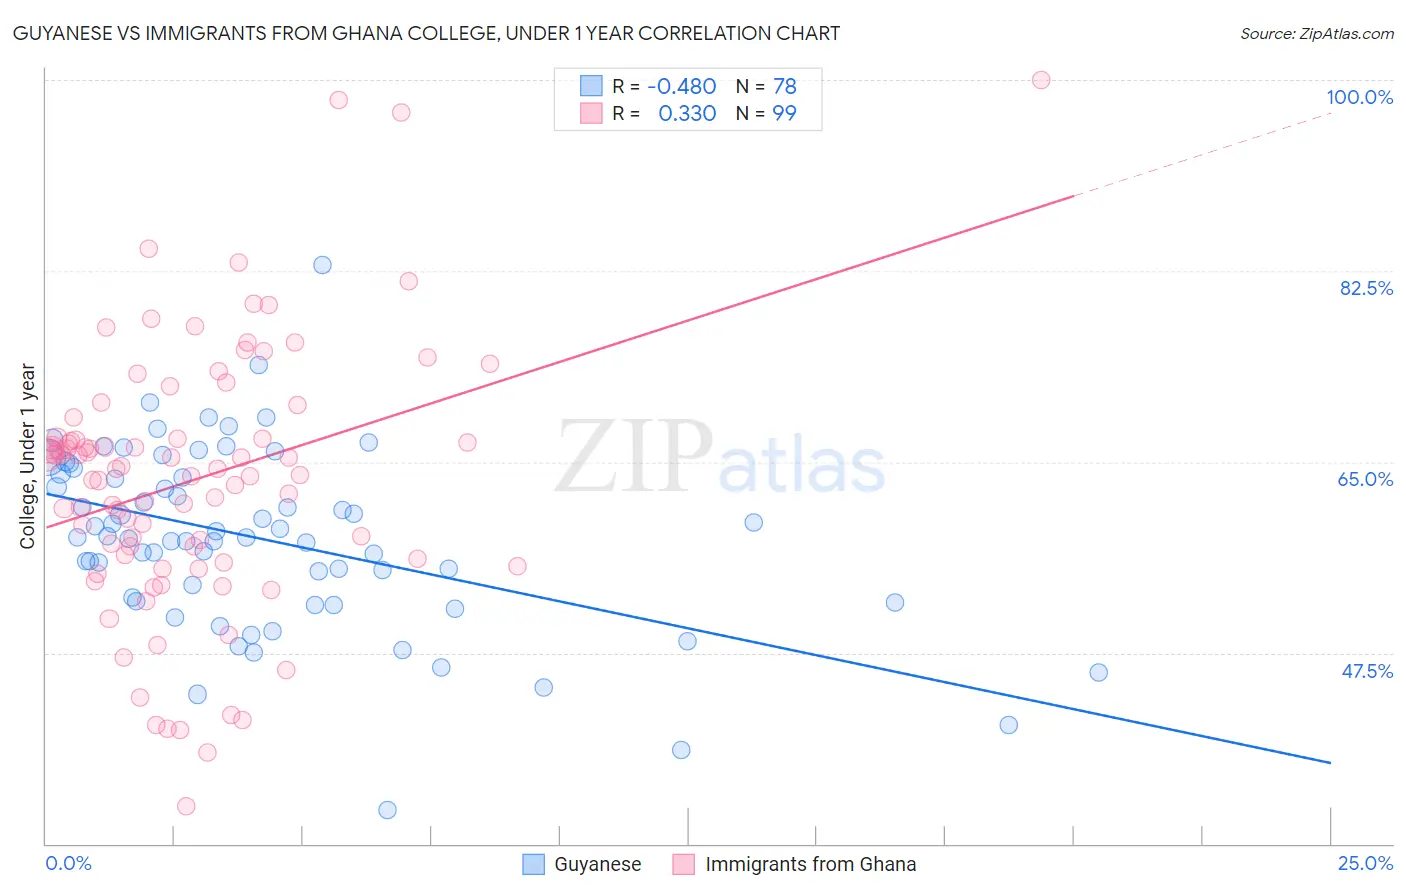
Guyanese vs Immigrants from Ghana College, Under 1 year Correlation Chart
The statistical analysis conducted on geographies consisting of 176,940,589 people shows a moderate negative correlation between the proportion of Guyanese and percentage of population with at least college, under 1 year education in the United States with a correlation coefficient (R) of -0.480 and weighted average of 59.0%. Similarly, the statistical analysis conducted on geographies consisting of 199,951,982 people shows a mild positive correlation between the proportion of Immigrants from Ghana and percentage of population with at least college, under 1 year education in the United States with a correlation coefficient (R) of 0.330 and weighted average of 63.1%, a difference of 6.9%.
College, Under 1 year Correlation Summary
| Measurement | Guyanese | Immigrants from Ghana |
| Minimum | 33.1% | 33.5% |
| Maximum | 83.1% | 100.0% |
| Range | 50.0% | 66.5% |
| Mean | 57.9% | 63.3% |
| Median | 58.1% | 64.4% |
| Interquartile 25% (IQ1) | 52.3% | 56.1% |
| Interquartile 75% (IQ3) | 64.0% | 67.3% |
| Interquartile Range (IQR) | 11.7% | 11.2% |
| Standard Deviation (Sample) | 8.4% | 12.1% |
| Standard Deviation (Population) | 8.3% | 12.1% |
Similar Demographics by College, Under 1 year
Demographics Similar to Guyanese by College, Under 1 year
In terms of college, under 1 year, the demographic groups most similar to Guyanese are Central American Indian (59.0%, a difference of 0.040%), Immigrants from Grenada (59.1%, a difference of 0.080%), Immigrants from Belize (59.1%, a difference of 0.19%), Seminole (59.1%, a difference of 0.21%), and Nicaraguan (59.2%, a difference of 0.39%).
| Demographics | Rating | Rank | College, Under 1 year |
| Ecuadorians | 0.0 /100 | #290 | Tragic 59.3% |
| Creek | 0.0 /100 | #291 | Tragic 59.3% |
| Nicaraguans | 0.0 /100 | #292 | Tragic 59.2% |
| Seminole | 0.0 /100 | #293 | Tragic 59.1% |
| Immigrants | Belize | 0.0 /100 | #294 | Tragic 59.1% |
| Immigrants | Grenada | 0.0 /100 | #295 | Tragic 59.1% |
| Central American Indians | 0.0 /100 | #296 | Tragic 59.0% |
| Guyanese | 0.0 /100 | #297 | Tragic 59.0% |
| Immigrants | Ecuador | 0.0 /100 | #298 | Tragic 58.7% |
| Cubans | 0.0 /100 | #299 | Tragic 58.6% |
| Immigrants | Guyana | 0.0 /100 | #300 | Tragic 58.5% |
| Mexican American Indians | 0.0 /100 | #301 | Tragic 58.1% |
| Apache | 0.0 /100 | #302 | Tragic 58.0% |
| Immigrants | Dominica | 0.0 /100 | #303 | Tragic 57.9% |
| Kiowa | 0.0 /100 | #304 | Tragic 57.8% |
Demographics Similar to Immigrants from Ghana by College, Under 1 year
In terms of college, under 1 year, the demographic groups most similar to Immigrants from Ghana are Immigrants from Colombia (63.1%, a difference of 0.090%), Immigrants from Peru (63.1%, a difference of 0.11%), Samoan (63.0%, a difference of 0.11%), Liberian (63.0%, a difference of 0.17%), and Subsaharan African (63.2%, a difference of 0.21%).
| Demographics | Rating | Rank | College, Under 1 year |
| Portuguese | 5.6 /100 | #220 | Tragic 63.4% |
| Cree | 5.2 /100 | #221 | Tragic 63.3% |
| Immigrants | Senegal | 5.0 /100 | #222 | Tragic 63.3% |
| Immigrants | Costa Rica | 4.5 /100 | #223 | Tragic 63.2% |
| Sub-Saharan Africans | 4.4 /100 | #224 | Tragic 63.2% |
| Immigrants | Peru | 4.0 /100 | #225 | Tragic 63.1% |
| Immigrants | Colombia | 4.0 /100 | #226 | Tragic 63.1% |
| Immigrants | Ghana | 3.7 /100 | #227 | Tragic 63.1% |
| Samoans | 3.3 /100 | #228 | Tragic 63.0% |
| Liberians | 3.2 /100 | #229 | Tragic 63.0% |
| Immigrants | Nonimmigrants | 3.0 /100 | #230 | Tragic 62.9% |
| Immigrants | Western Africa | 2.4 /100 | #231 | Tragic 62.8% |
| Osage | 2.2 /100 | #232 | Tragic 62.7% |
| Iroquois | 2.0 /100 | #233 | Tragic 62.6% |
| Chippewa | 2.0 /100 | #234 | Tragic 62.6% |