Guyanese vs Chilean In Labor Force | Age > 16
COMPARE
Guyanese
Chilean
In Labor Force | Age > 16
In Labor Force | Age > 16 Comparison
Guyanese
Chileans
64.1%
IN LABOR FORCE | AGE > 16
0.4/ 100
METRIC RATING
270th/ 347
METRIC RANK
66.0%
IN LABOR FORCE | AGE > 16
99.2/ 100
METRIC RATING
90th/ 347
METRIC RANK
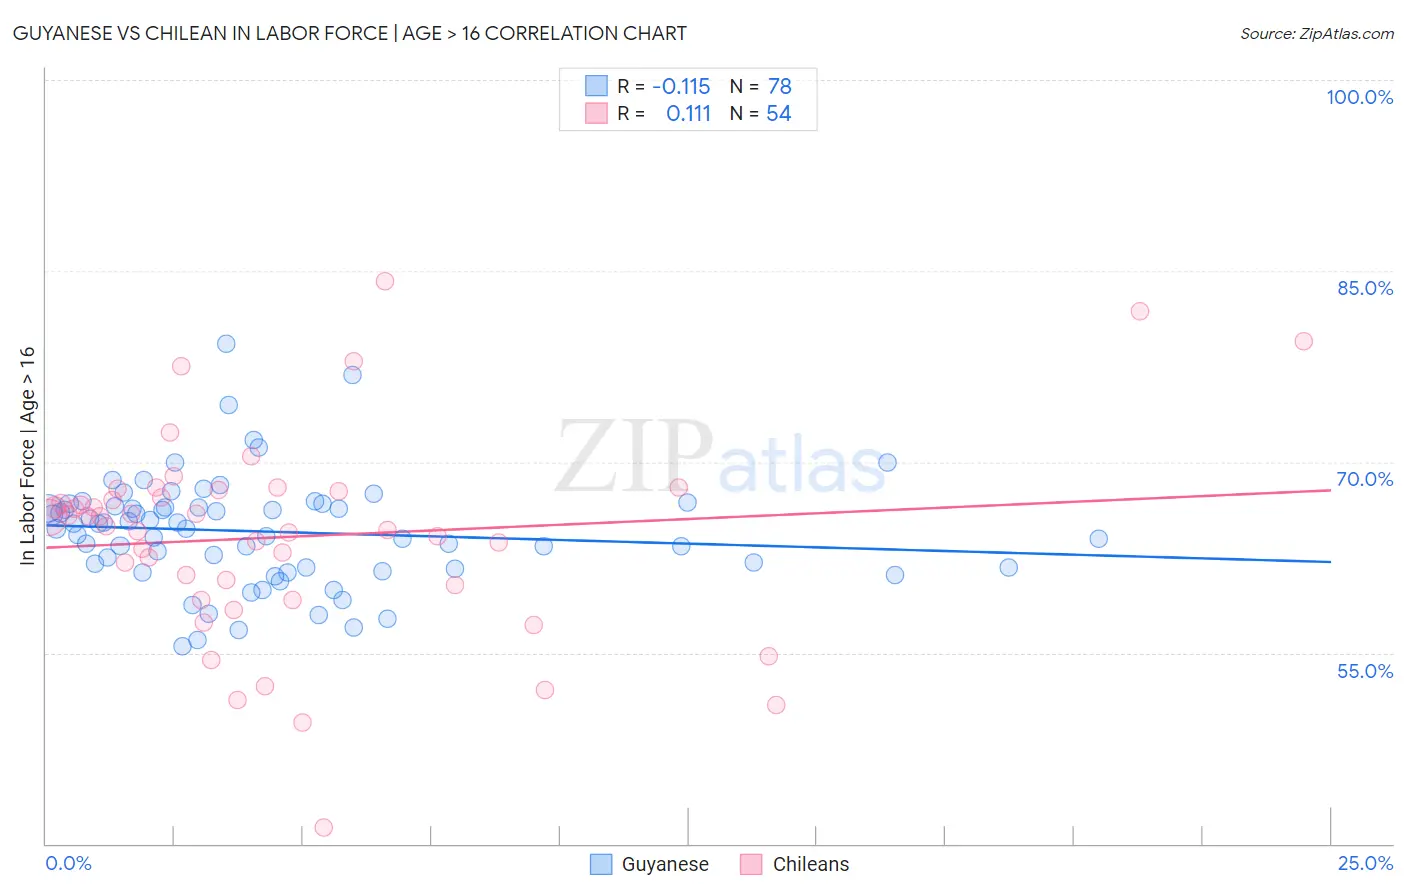
Guyanese vs Chilean In Labor Force | Age > 16 Correlation Chart
The statistical analysis conducted on geographies consisting of 176,935,808 people shows a poor negative correlation between the proportion of Guyanese and labor force participation rate among population ages 16 and over in the United States with a correlation coefficient (R) of -0.115 and weighted average of 64.1%. Similarly, the statistical analysis conducted on geographies consisting of 256,687,102 people shows a poor positive correlation between the proportion of Chileans and labor force participation rate among population ages 16 and over in the United States with a correlation coefficient (R) of 0.111 and weighted average of 66.0%, a difference of 3.0%.
In Labor Force | Age > 16 Correlation Summary
| Measurement | Guyanese | Chilean |
| Minimum | 55.5% | 41.3% |
| Maximum | 79.3% | 84.2% |
| Range | 23.8% | 42.9% |
| Mean | 64.5% | 64.1% |
| Median | 64.9% | 65.3% |
| Interquartile 25% (IQ1) | 61.7% | 60.3% |
| Interquartile 75% (IQ3) | 66.5% | 67.7% |
| Interquartile Range (IQR) | 4.8% | 7.4% |
| Standard Deviation (Sample) | 4.3% | 8.0% |
| Standard Deviation (Population) | 4.3% | 7.9% |
Similar Demographics by In Labor Force | Age > 16
Demographics Similar to Guyanese by In Labor Force | Age > 16
In terms of in labor force | age > 16, the demographic groups most similar to Guyanese are Dominican (64.1%, a difference of 0.0%), Irish (64.1%, a difference of 0.030%), Native Hawaiian (64.1%, a difference of 0.030%), Hmong (64.1%, a difference of 0.030%), and Immigrants from Cuba (64.1%, a difference of 0.050%).
| Demographics | Rating | Rank | In Labor Force | Age > 16 |
| Bahamians | 0.6 /100 | #263 | Tragic 64.2% |
| Dutch | 0.6 /100 | #264 | Tragic 64.2% |
| Cubans | 0.5 /100 | #265 | Tragic 64.2% |
| Immigrants | England | 0.5 /100 | #266 | Tragic 64.2% |
| Canadians | 0.5 /100 | #267 | Tragic 64.1% |
| Spaniards | 0.5 /100 | #268 | Tragic 64.1% |
| Irish | 0.4 /100 | #269 | Tragic 64.1% |
| Guyanese | 0.4 /100 | #270 | Tragic 64.1% |
| Dominicans | 0.4 /100 | #271 | Tragic 64.1% |
| Native Hawaiians | 0.3 /100 | #272 | Tragic 64.1% |
| Hmong | 0.3 /100 | #273 | Tragic 64.1% |
| Immigrants | Cuba | 0.3 /100 | #274 | Tragic 64.1% |
| Mexicans | 0.3 /100 | #275 | Tragic 64.1% |
| French American Indians | 0.3 /100 | #276 | Tragic 64.1% |
| Immigrants | Bahamas | 0.3 /100 | #277 | Tragic 64.0% |
Demographics Similar to Chileans by In Labor Force | Age > 16
In terms of in labor force | age > 16, the demographic groups most similar to Chileans are Immigrants from Laos (66.0%, a difference of 0.0%), Iranian (66.0%, a difference of 0.010%), Aleut (66.0%, a difference of 0.030%), Immigrants from South America (66.0%, a difference of 0.030%), and South American Indian (66.0%, a difference of 0.050%).
| Demographics | Rating | Rank | In Labor Force | Age > 16 |
| Immigrants | Jordan | 99.4 /100 | #83 | Exceptional 66.1% |
| Central Americans | 99.4 /100 | #84 | Exceptional 66.1% |
| Mongolians | 99.4 /100 | #85 | Exceptional 66.1% |
| South Americans | 99.4 /100 | #86 | Exceptional 66.0% |
| South American Indians | 99.4 /100 | #87 | Exceptional 66.0% |
| Bermudans | 99.3 /100 | #88 | Exceptional 66.0% |
| Immigrants | Laos | 99.2 /100 | #89 | Exceptional 66.0% |
| Chileans | 99.2 /100 | #90 | Exceptional 66.0% |
| Iranians | 99.2 /100 | #91 | Exceptional 66.0% |
| Aleuts | 99.1 /100 | #92 | Exceptional 66.0% |
| Immigrants | South America | 99.1 /100 | #93 | Exceptional 66.0% |
| Immigrants | Cambodia | 99.1 /100 | #94 | Exceptional 66.0% |
| Immigrants | Uruguay | 99.1 /100 | #95 | Exceptional 66.0% |
| Bangladeshis | 98.9 /100 | #96 | Exceptional 65.9% |
| Filipinos | 98.9 /100 | #97 | Exceptional 65.9% |