Guyanese vs Chilean Vision Disability
COMPARE
Guyanese
Chilean
Vision Disability
Vision Disability Comparison
Guyanese
Chileans
2.2%
VISION DISABILITY
28.9/ 100
METRIC RATING
188th/ 347
METRIC RANK
2.1%
VISION DISABILITY
94.0/ 100
METRIC RATING
109th/ 347
METRIC RANK
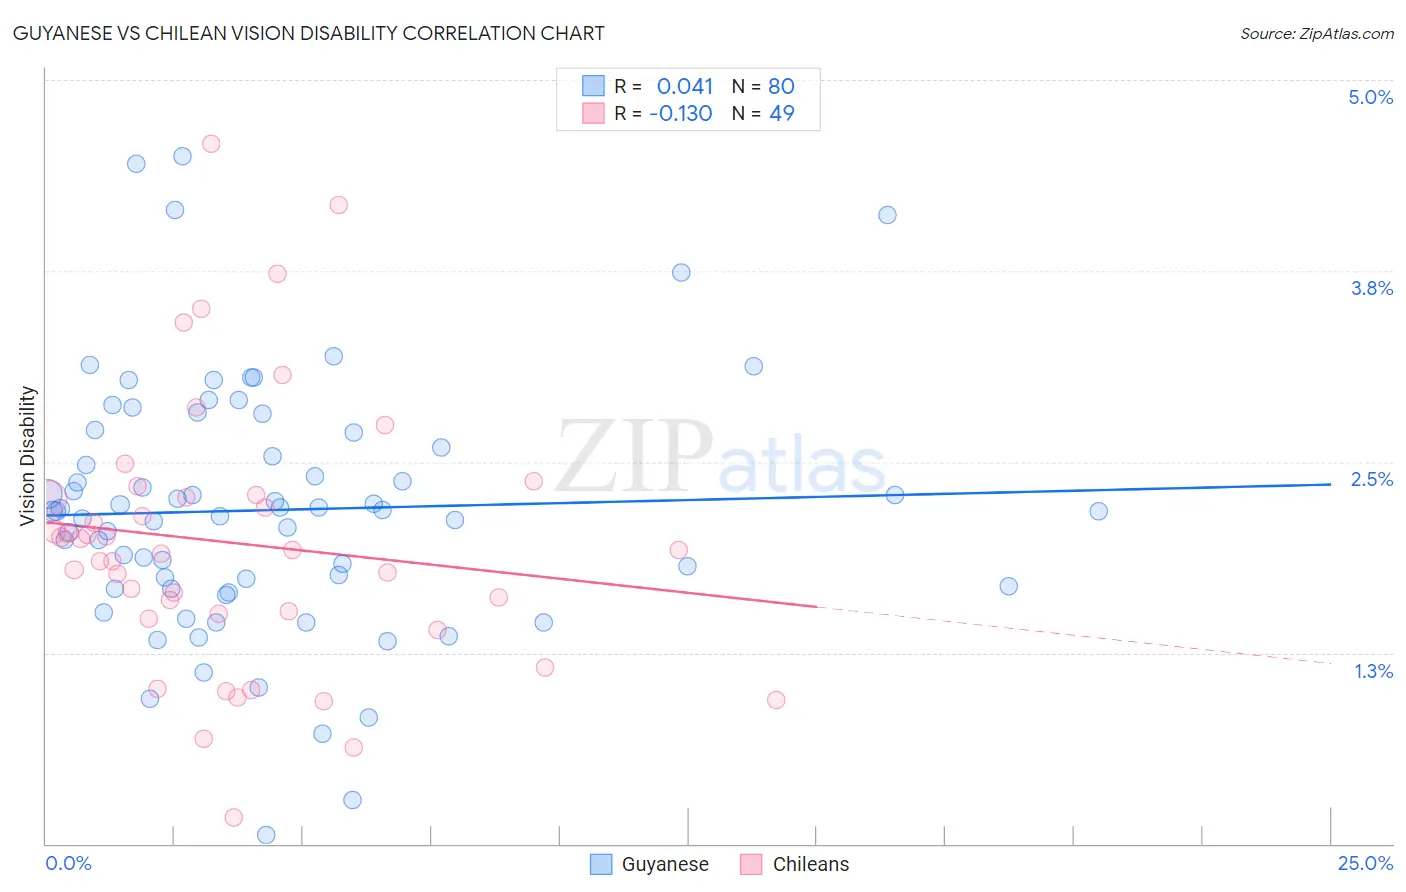
Guyanese vs Chilean Vision Disability Correlation Chart
The statistical analysis conducted on geographies consisting of 176,846,662 people shows no correlation between the proportion of Guyanese and percentage of population with vision disability in the United States with a correlation coefficient (R) of 0.041 and weighted average of 2.2%. Similarly, the statistical analysis conducted on geographies consisting of 256,590,640 people shows a poor negative correlation between the proportion of Chileans and percentage of population with vision disability in the United States with a correlation coefficient (R) of -0.130 and weighted average of 2.1%, a difference of 6.0%.
Vision Disability Correlation Summary
| Measurement | Guyanese | Chilean |
| Minimum | 0.061% | 0.17% |
| Maximum | 4.5% | 4.6% |
| Range | 4.4% | 4.4% |
| Mean | 2.2% | 2.0% |
| Median | 2.2% | 1.9% |
| Interquartile 25% (IQ1) | 1.7% | 1.5% |
| Interquartile 75% (IQ3) | 2.6% | 2.3% |
| Interquartile Range (IQR) | 0.97% | 0.79% |
| Standard Deviation (Sample) | 0.83% | 0.89% |
| Standard Deviation (Population) | 0.82% | 0.88% |
Similar Demographics by Vision Disability
Demographics Similar to Guyanese by Vision Disability
In terms of vision disability, the demographic groups most similar to Guyanese are Immigrants from St. Vincent and the Grenadines (2.2%, a difference of 0.11%), Salvadoran (2.2%, a difference of 0.11%), Immigrants from Costa Rica (2.2%, a difference of 0.22%), Canadian (2.2%, a difference of 0.24%), and European (2.2%, a difference of 0.24%).
| Demographics | Rating | Rank | Vision Disability |
| Immigrants | Western Europe | 41.1 /100 | #181 | Average 2.2% |
| Costa Ricans | 40.7 /100 | #182 | Average 2.2% |
| Immigrants | Burma/Myanmar | 37.9 /100 | #183 | Fair 2.2% |
| Moroccans | 35.4 /100 | #184 | Fair 2.2% |
| Immigrants | Middle Africa | 33.5 /100 | #185 | Fair 2.2% |
| Native Hawaiians | 33.3 /100 | #186 | Fair 2.2% |
| Immigrants | St. Vincent and the Grenadines | 30.3 /100 | #187 | Fair 2.2% |
| Guyanese | 28.9 /100 | #188 | Fair 2.2% |
| Salvadorans | 27.4 /100 | #189 | Fair 2.2% |
| Immigrants | Costa Rica | 26.1 /100 | #190 | Fair 2.2% |
| Canadians | 25.8 /100 | #191 | Fair 2.2% |
| Europeans | 25.7 /100 | #192 | Fair 2.2% |
| British | 25.1 /100 | #193 | Fair 2.2% |
| Immigrants | Barbados | 24.0 /100 | #194 | Fair 2.2% |
| Immigrants | Immigrants | 23.7 /100 | #195 | Fair 2.2% |
Demographics Similar to Chileans by Vision Disability
In terms of vision disability, the demographic groups most similar to Chileans are Korean (2.1%, a difference of 0.020%), Swedish (2.1%, a difference of 0.050%), Danish (2.1%, a difference of 0.050%), Immigrants from Armenia (2.1%, a difference of 0.070%), and Carpatho Rusyn (2.1%, a difference of 0.10%).
| Demographics | Rating | Rank | Vision Disability |
| Sri Lankans | 94.8 /100 | #102 | Exceptional 2.1% |
| Immigrants | Austria | 94.4 /100 | #103 | Exceptional 2.1% |
| Immigrants | Italy | 94.4 /100 | #104 | Exceptional 2.1% |
| Carpatho Rusyns | 94.3 /100 | #105 | Exceptional 2.1% |
| Swedes | 94.2 /100 | #106 | Exceptional 2.1% |
| Danes | 94.2 /100 | #107 | Exceptional 2.1% |
| Koreans | 94.1 /100 | #108 | Exceptional 2.1% |
| Chileans | 94.0 /100 | #109 | Exceptional 2.1% |
| Immigrants | Armenia | 93.8 /100 | #110 | Exceptional 2.1% |
| Peruvians | 93.5 /100 | #111 | Exceptional 2.1% |
| Immigrants | Denmark | 92.9 /100 | #112 | Exceptional 2.1% |
| Kenyans | 92.5 /100 | #113 | Exceptional 2.1% |
| Croatians | 92.3 /100 | #114 | Exceptional 2.1% |
| Immigrants | Vietnam | 92.2 /100 | #115 | Exceptional 2.1% |
| Ugandans | 92.2 /100 | #116 | Exceptional 2.1% |