Belizean vs Tsimshian 12th Grade, No Diploma
COMPARE
Belizean
Tsimshian
12th Grade, No Diploma
12th Grade, No Diploma Comparison
Belizeans
Tsimshian
87.0%
12TH GRADE, NO DIPLOMA
0.0/ 100
METRIC RATING
318th/ 347
METRIC RANK
92.9%
12TH GRADE, NO DIPLOMA
99.8/ 100
METRIC RATING
50th/ 347
METRIC RANK
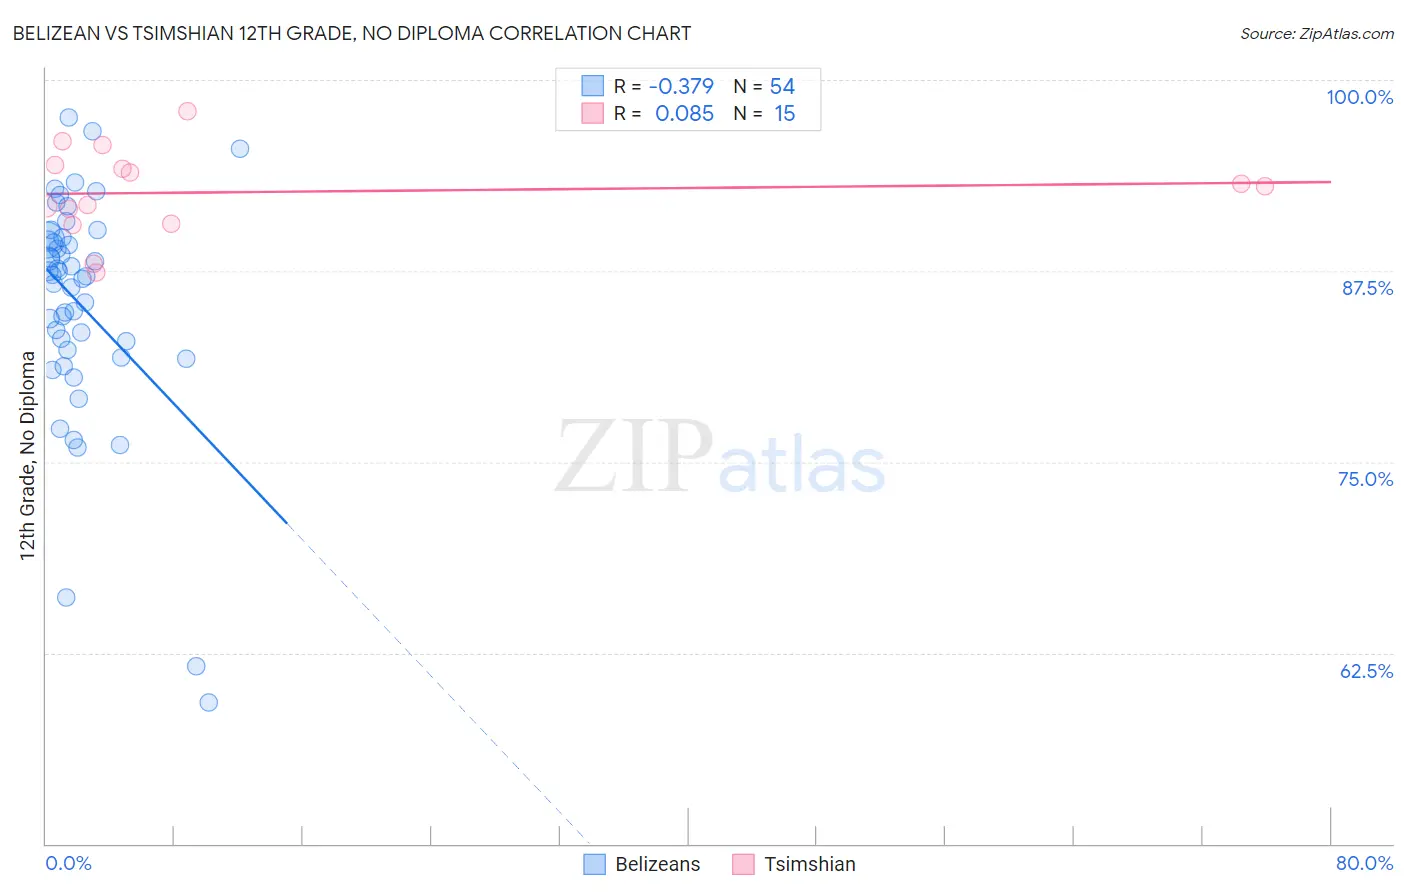
Belizean vs Tsimshian 12th Grade, No Diploma Correlation Chart
The statistical analysis conducted on geographies consisting of 144,225,006 people shows a mild negative correlation between the proportion of Belizeans and percentage of population with at least 12th grade (no diploma) education in the United States with a correlation coefficient (R) of -0.379 and weighted average of 87.0%. Similarly, the statistical analysis conducted on geographies consisting of 15,626,544 people shows a slight positive correlation between the proportion of Tsimshian and percentage of population with at least 12th grade (no diploma) education in the United States with a correlation coefficient (R) of 0.085 and weighted average of 92.9%, a difference of 6.7%.
12th Grade, No Diploma Correlation Summary
| Measurement | Belizean | Tsimshian |
| Minimum | 59.3% | 87.4% |
| Maximum | 97.5% | 98.0% |
| Range | 38.2% | 10.6% |
| Mean | 85.3% | 92.7% |
| Median | 87.2% | 93.0% |
| Interquartile 25% (IQ1) | 82.3% | 90.6% |
| Interquartile 75% (IQ3) | 89.5% | 94.4% |
| Interquartile Range (IQR) | 7.2% | 3.8% |
| Standard Deviation (Sample) | 7.5% | 2.9% |
| Standard Deviation (Population) | 7.5% | 2.8% |
Similar Demographics by 12th Grade, No Diploma
Demographics Similar to Belizeans by 12th Grade, No Diploma
In terms of 12th grade, no diploma, the demographic groups most similar to Belizeans are Navajo (87.1%, a difference of 0.060%), Immigrants from Belize (87.0%, a difference of 0.080%), Apache (87.3%, a difference of 0.35%), Nicaraguan (87.3%, a difference of 0.36%), and Cape Verdean (87.4%, a difference of 0.40%).
| Demographics | Rating | Rank | 12th Grade, No Diploma |
| Yaqui | 0.0 /100 | #311 | Tragic 87.5% |
| Immigrants | Ecuador | 0.0 /100 | #312 | Tragic 87.5% |
| Immigrants | Caribbean | 0.0 /100 | #313 | Tragic 87.4% |
| Cape Verdeans | 0.0 /100 | #314 | Tragic 87.4% |
| Nicaraguans | 0.0 /100 | #315 | Tragic 87.3% |
| Apache | 0.0 /100 | #316 | Tragic 87.3% |
| Navajo | 0.0 /100 | #317 | Tragic 87.1% |
| Belizeans | 0.0 /100 | #318 | Tragic 87.0% |
| Immigrants | Belize | 0.0 /100 | #319 | Tragic 87.0% |
| Immigrants | Nicaragua | 0.0 /100 | #320 | Tragic 86.6% |
| Puerto Ricans | 0.0 /100 | #321 | Tragic 86.5% |
| Central American Indians | 0.0 /100 | #322 | Tragic 86.5% |
| Yuman | 0.0 /100 | #323 | Tragic 86.5% |
| Immigrants | Cabo Verde | 0.0 /100 | #324 | Tragic 85.8% |
| Mexican American Indians | 0.0 /100 | #325 | Tragic 85.7% |
Demographics Similar to Tsimshian by 12th Grade, No Diploma
In terms of 12th grade, no diploma, the demographic groups most similar to Tsimshian are Immigrants from Belgium (92.9%, a difference of 0.0%), Macedonian (92.9%, a difference of 0.010%), Immigrants from Sweden (92.8%, a difference of 0.010%), Australian (92.9%, a difference of 0.020%), and Belgian (92.9%, a difference of 0.030%).
| Demographics | Rating | Rank | 12th Grade, No Diploma |
| Northern Europeans | 99.8 /100 | #43 | Exceptional 92.9% |
| Dutch | 99.8 /100 | #44 | Exceptional 92.9% |
| Greeks | 99.8 /100 | #45 | Exceptional 92.9% |
| British | 99.8 /100 | #46 | Exceptional 92.9% |
| Belgians | 99.8 /100 | #47 | Exceptional 92.9% |
| Australians | 99.8 /100 | #48 | Exceptional 92.9% |
| Macedonians | 99.8 /100 | #49 | Exceptional 92.9% |
| Tsimshian | 99.8 /100 | #50 | Exceptional 92.9% |
| Immigrants | Belgium | 99.8 /100 | #51 | Exceptional 92.9% |
| Immigrants | Sweden | 99.8 /100 | #52 | Exceptional 92.8% |
| Serbians | 99.7 /100 | #53 | Exceptional 92.8% |
| Hungarians | 99.7 /100 | #54 | Exceptional 92.8% |
| Welsh | 99.7 /100 | #55 | Exceptional 92.8% |
| New Zealanders | 99.7 /100 | #56 | Exceptional 92.8% |
| Immigrants | Canada | 99.7 /100 | #57 | Exceptional 92.8% |