Comanche vs Tsimshian 12th Grade, No Diploma
COMPARE
Comanche
Tsimshian
12th Grade, No Diploma
12th Grade, No Diploma Comparison
Comanche
Tsimshian
89.9%
12TH GRADE, NO DIPLOMA
1.1/ 100
METRIC RATING
248th/ 347
METRIC RANK
92.9%
12TH GRADE, NO DIPLOMA
99.8/ 100
METRIC RATING
50th/ 347
METRIC RANK
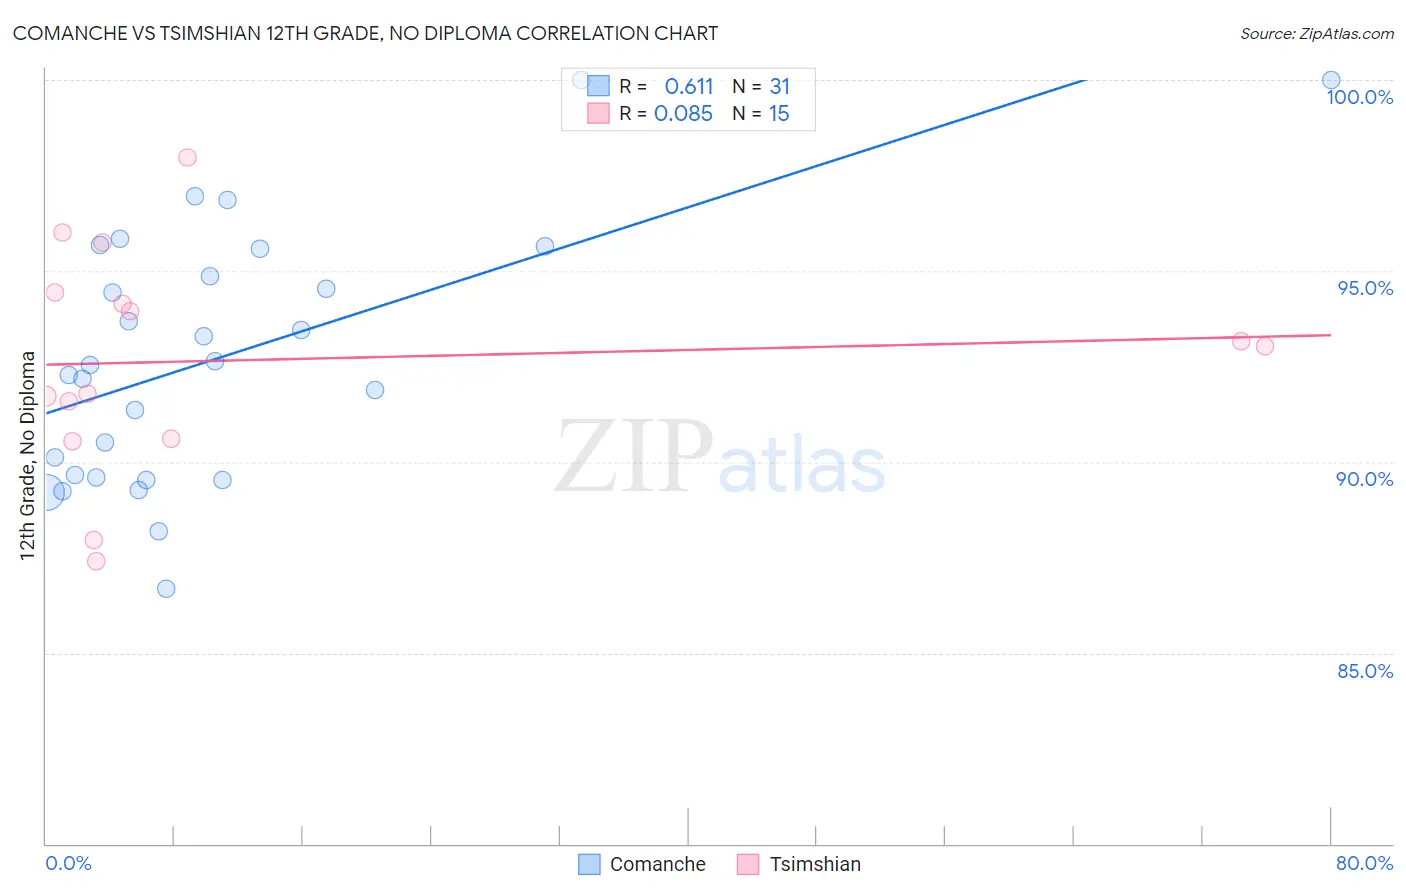
Comanche vs Tsimshian 12th Grade, No Diploma Correlation Chart
The statistical analysis conducted on geographies consisting of 109,786,530 people shows a significant positive correlation between the proportion of Comanche and percentage of population with at least 12th grade (no diploma) education in the United States with a correlation coefficient (R) of 0.611 and weighted average of 89.9%. Similarly, the statistical analysis conducted on geographies consisting of 15,626,544 people shows a slight positive correlation between the proportion of Tsimshian and percentage of population with at least 12th grade (no diploma) education in the United States with a correlation coefficient (R) of 0.085 and weighted average of 92.9%, a difference of 3.3%.
12th Grade, No Diploma Correlation Summary
| Measurement | Comanche | Tsimshian |
| Minimum | 86.7% | 87.4% |
| Maximum | 100.0% | 98.0% |
| Range | 13.3% | 10.6% |
| Mean | 92.7% | 92.7% |
| Median | 92.5% | 93.0% |
| Interquartile 25% (IQ1) | 89.6% | 90.6% |
| Interquartile 75% (IQ3) | 95.6% | 94.4% |
| Interquartile Range (IQR) | 6.0% | 3.8% |
| Standard Deviation (Sample) | 3.4% | 2.9% |
| Standard Deviation (Population) | 3.3% | 2.8% |
Similar Demographics by 12th Grade, No Diploma
Demographics Similar to Comanche by 12th Grade, No Diploma
In terms of 12th grade, no diploma, the demographic groups most similar to Comanche are Senegalese (89.9%, a difference of 0.0%), Immigrants from Eritrea (89.9%, a difference of 0.030%), Spanish American (89.9%, a difference of 0.040%), Immigrants from Nigeria (89.9%, a difference of 0.050%), and Bahamian (89.9%, a difference of 0.050%).
| Demographics | Rating | Rank | 12th Grade, No Diploma |
| Immigrants | Middle Africa | 1.7 /100 | #241 | Tragic 90.0% |
| Immigrants | Costa Rica | 1.6 /100 | #242 | Tragic 90.0% |
| Crow | 1.5 /100 | #243 | Tragic 90.0% |
| Taiwanese | 1.5 /100 | #244 | Tragic 90.0% |
| Immigrants | Uruguay | 1.4 /100 | #245 | Tragic 90.0% |
| Ghanaians | 1.3 /100 | #246 | Tragic 90.0% |
| Immigrants | Nigeria | 1.3 /100 | #247 | Tragic 89.9% |
| Comanche | 1.1 /100 | #248 | Tragic 89.9% |
| Senegalese | 1.1 /100 | #249 | Tragic 89.9% |
| Immigrants | Eritrea | 1.0 /100 | #250 | Tragic 89.9% |
| Spanish Americans | 0.9 /100 | #251 | Tragic 89.9% |
| Bahamians | 0.9 /100 | #252 | Tragic 89.9% |
| Choctaw | 0.7 /100 | #253 | Tragic 89.8% |
| Immigrants | Peru | 0.5 /100 | #254 | Tragic 89.7% |
| Immigrants | Senegal | 0.5 /100 | #255 | Tragic 89.7% |
Demographics Similar to Tsimshian by 12th Grade, No Diploma
In terms of 12th grade, no diploma, the demographic groups most similar to Tsimshian are Immigrants from Belgium (92.9%, a difference of 0.0%), Macedonian (92.9%, a difference of 0.010%), Immigrants from Sweden (92.8%, a difference of 0.010%), Australian (92.9%, a difference of 0.020%), and Belgian (92.9%, a difference of 0.030%).
| Demographics | Rating | Rank | 12th Grade, No Diploma |
| Northern Europeans | 99.8 /100 | #43 | Exceptional 92.9% |
| Dutch | 99.8 /100 | #44 | Exceptional 92.9% |
| Greeks | 99.8 /100 | #45 | Exceptional 92.9% |
| British | 99.8 /100 | #46 | Exceptional 92.9% |
| Belgians | 99.8 /100 | #47 | Exceptional 92.9% |
| Australians | 99.8 /100 | #48 | Exceptional 92.9% |
| Macedonians | 99.8 /100 | #49 | Exceptional 92.9% |
| Tsimshian | 99.8 /100 | #50 | Exceptional 92.9% |
| Immigrants | Belgium | 99.8 /100 | #51 | Exceptional 92.9% |
| Immigrants | Sweden | 99.8 /100 | #52 | Exceptional 92.8% |
| Serbians | 99.7 /100 | #53 | Exceptional 92.8% |
| Hungarians | 99.7 /100 | #54 | Exceptional 92.8% |
| Welsh | 99.7 /100 | #55 | Exceptional 92.8% |
| New Zealanders | 99.7 /100 | #56 | Exceptional 92.8% |
| Immigrants | Canada | 99.7 /100 | #57 | Exceptional 92.8% |