Tohono O'odham vs Tsimshian 12th Grade, No Diploma
COMPARE
Tohono O'odham
Tsimshian
12th Grade, No Diploma
12th Grade, No Diploma Comparison
Tohono O'odham
Tsimshian
84.7%
12TH GRADE, NO DIPLOMA
0.0/ 100
METRIC RATING
336th/ 347
METRIC RANK
92.9%
12TH GRADE, NO DIPLOMA
99.8/ 100
METRIC RATING
50th/ 347
METRIC RANK
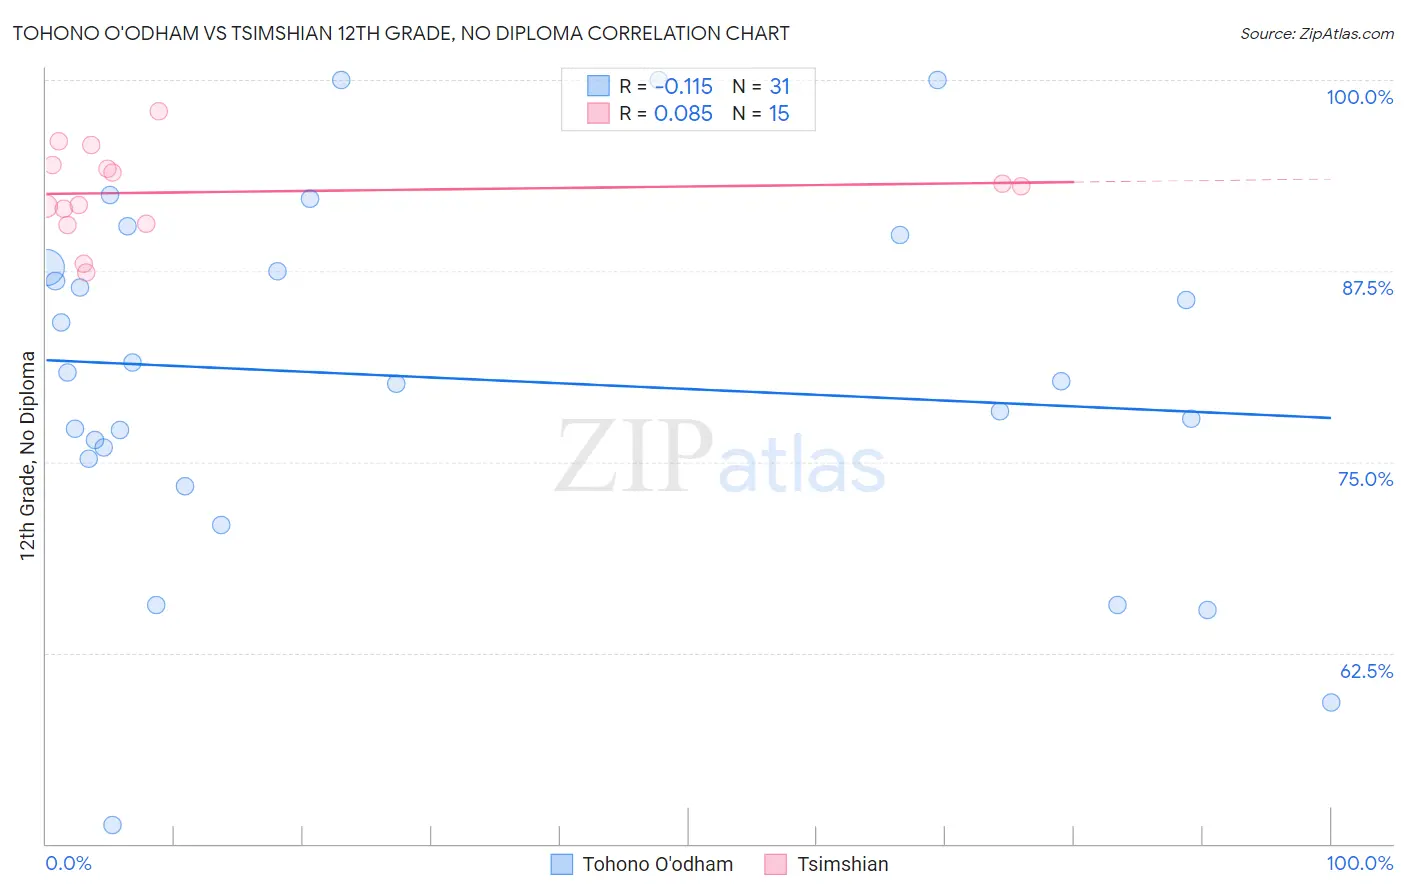
Tohono O'odham vs Tsimshian 12th Grade, No Diploma Correlation Chart
The statistical analysis conducted on geographies consisting of 58,730,615 people shows a poor negative correlation between the proportion of Tohono O'odham and percentage of population with at least 12th grade (no diploma) education in the United States with a correlation coefficient (R) of -0.115 and weighted average of 84.7%. Similarly, the statistical analysis conducted on geographies consisting of 15,626,544 people shows a slight positive correlation between the proportion of Tsimshian and percentage of population with at least 12th grade (no diploma) education in the United States with a correlation coefficient (R) of 0.085 and weighted average of 92.9%, a difference of 9.6%.
12th Grade, No Diploma Correlation Summary
| Measurement | Tohono O'odham | Tsimshian |
| Minimum | 51.2% | 87.4% |
| Maximum | 100.0% | 98.0% |
| Range | 48.8% | 10.6% |
| Mean | 80.5% | 92.7% |
| Median | 80.3% | 93.0% |
| Interquartile 25% (IQ1) | 75.2% | 90.6% |
| Interquartile 75% (IQ3) | 87.7% | 94.4% |
| Interquartile Range (IQR) | 12.5% | 3.8% |
| Standard Deviation (Sample) | 11.6% | 2.9% |
| Standard Deviation (Population) | 11.4% | 2.8% |
Similar Demographics by 12th Grade, No Diploma
Demographics Similar to Tohono O'odham by 12th Grade, No Diploma
In terms of 12th grade, no diploma, the demographic groups most similar to Tohono O'odham are Pima (84.6%, a difference of 0.13%), Immigrants from Yemen (84.8%, a difference of 0.14%), Immigrants from Dominican Republic (84.9%, a difference of 0.18%), Guatemalan (84.6%, a difference of 0.18%), and Salvadoran (84.5%, a difference of 0.27%).
| Demographics | Rating | Rank | 12th Grade, No Diploma |
| Hispanics or Latinos | 0.0 /100 | #329 | Tragic 85.4% |
| Immigrants | Azores | 0.0 /100 | #330 | Tragic 85.3% |
| Central Americans | 0.0 /100 | #331 | Tragic 85.2% |
| Immigrants | Honduras | 0.0 /100 | #332 | Tragic 85.0% |
| Immigrants | Latin America | 0.0 /100 | #333 | Tragic 85.0% |
| Immigrants | Dominican Republic | 0.0 /100 | #334 | Tragic 84.9% |
| Immigrants | Yemen | 0.0 /100 | #335 | Tragic 84.8% |
| Tohono O'odham | 0.0 /100 | #336 | Tragic 84.7% |
| Pima | 0.0 /100 | #337 | Tragic 84.6% |
| Guatemalans | 0.0 /100 | #338 | Tragic 84.6% |
| Salvadorans | 0.0 /100 | #339 | Tragic 84.5% |
| Mexicans | 0.0 /100 | #340 | Tragic 84.1% |
| Immigrants | Guatemala | 0.0 /100 | #341 | Tragic 84.0% |
| Houma | 0.0 /100 | #342 | Tragic 83.7% |
| Immigrants | El Salvador | 0.0 /100 | #343 | Tragic 83.6% |
Demographics Similar to Tsimshian by 12th Grade, No Diploma
In terms of 12th grade, no diploma, the demographic groups most similar to Tsimshian are Immigrants from Belgium (92.9%, a difference of 0.0%), Macedonian (92.9%, a difference of 0.010%), Immigrants from Sweden (92.8%, a difference of 0.010%), Australian (92.9%, a difference of 0.020%), and Belgian (92.9%, a difference of 0.030%).
| Demographics | Rating | Rank | 12th Grade, No Diploma |
| Northern Europeans | 99.8 /100 | #43 | Exceptional 92.9% |
| Dutch | 99.8 /100 | #44 | Exceptional 92.9% |
| Greeks | 99.8 /100 | #45 | Exceptional 92.9% |
| British | 99.8 /100 | #46 | Exceptional 92.9% |
| Belgians | 99.8 /100 | #47 | Exceptional 92.9% |
| Australians | 99.8 /100 | #48 | Exceptional 92.9% |
| Macedonians | 99.8 /100 | #49 | Exceptional 92.9% |
| Tsimshian | 99.8 /100 | #50 | Exceptional 92.9% |
| Immigrants | Belgium | 99.8 /100 | #51 | Exceptional 92.9% |
| Immigrants | Sweden | 99.8 /100 | #52 | Exceptional 92.8% |
| Serbians | 99.7 /100 | #53 | Exceptional 92.8% |
| Hungarians | 99.7 /100 | #54 | Exceptional 92.8% |
| Welsh | 99.7 /100 | #55 | Exceptional 92.8% |
| New Zealanders | 99.7 /100 | #56 | Exceptional 92.8% |
| Immigrants | Canada | 99.7 /100 | #57 | Exceptional 92.8% |