Ghanaian vs West Indian In Labor Force | Age > 16
COMPARE
Ghanaian
West Indian
In Labor Force | Age > 16
In Labor Force | Age > 16 Comparison
Ghanaians
West Indians
67.1%
IN LABOR FORCE | AGE > 16
100.0/ 100
METRIC RATING
31st/ 347
METRIC RANK
64.5%
IN LABOR FORCE | AGE > 16
3.0/ 100
METRIC RATING
245th/ 347
METRIC RANK
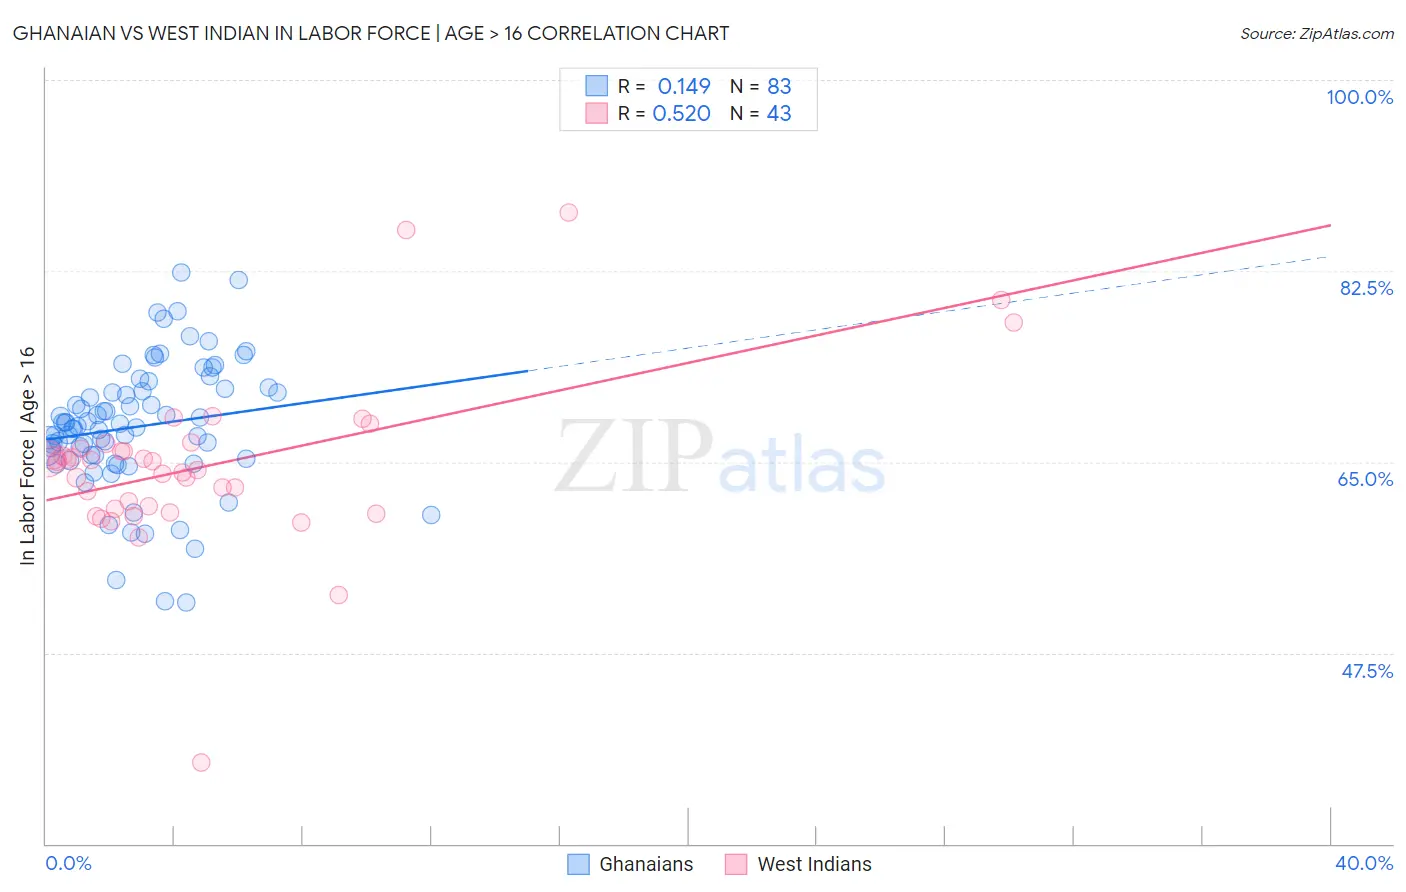
Ghanaian vs West Indian In Labor Force | Age > 16 Correlation Chart
The statistical analysis conducted on geographies consisting of 190,727,867 people shows a poor positive correlation between the proportion of Ghanaians and labor force participation rate among population ages 16 and over in the United States with a correlation coefficient (R) of 0.149 and weighted average of 67.1%. Similarly, the statistical analysis conducted on geographies consisting of 254,052,877 people shows a substantial positive correlation between the proportion of West Indians and labor force participation rate among population ages 16 and over in the United States with a correlation coefficient (R) of 0.520 and weighted average of 64.5%, a difference of 4.1%.
In Labor Force | Age > 16 Correlation Summary
| Measurement | Ghanaian | West Indian |
| Minimum | 52.1% | 37.5% |
| Maximum | 82.4% | 87.9% |
| Range | 30.3% | 50.4% |
| Mean | 68.2% | 64.8% |
| Median | 68.3% | 65.1% |
| Interquartile 25% (IQ1) | 65.3% | 60.7% |
| Interquartile 75% (IQ3) | 71.7% | 66.2% |
| Interquartile Range (IQR) | 6.4% | 5.5% |
| Standard Deviation (Sample) | 5.9% | 7.9% |
| Standard Deviation (Population) | 5.9% | 7.8% |
Similar Demographics by In Labor Force | Age > 16
Demographics Similar to Ghanaians by In Labor Force | Age > 16
In terms of in labor force | age > 16, the demographic groups most similar to Ghanaians are Immigrants from Congo (67.1%, a difference of 0.060%), Afghan (67.1%, a difference of 0.060%), Immigrants from Ghana (67.1%, a difference of 0.070%), Immigrants from Zaire (67.2%, a difference of 0.10%), and Thai (67.2%, a difference of 0.11%).
| Demographics | Rating | Rank | In Labor Force | Age > 16 |
| Ugandans | 100.0 /100 | #24 | Exceptional 67.4% |
| Immigrants | Africa | 100.0 /100 | #25 | Exceptional 67.4% |
| Immigrants | Cabo Verde | 100.0 /100 | #26 | Exceptional 67.3% |
| Zimbabweans | 100.0 /100 | #27 | Exceptional 67.3% |
| Immigrants | Morocco | 100.0 /100 | #28 | Exceptional 67.2% |
| Thais | 100.0 /100 | #29 | Exceptional 67.2% |
| Immigrants | Zaire | 100.0 /100 | #30 | Exceptional 67.2% |
| Ghanaians | 100.0 /100 | #31 | Exceptional 67.1% |
| Immigrants | Congo | 100.0 /100 | #32 | Exceptional 67.1% |
| Afghans | 100.0 /100 | #33 | Exceptional 67.1% |
| Immigrants | Ghana | 100.0 /100 | #34 | Exceptional 67.1% |
| Immigrants | South Central Asia | 100.0 /100 | #35 | Exceptional 67.1% |
| Immigrants | Western Africa | 100.0 /100 | #36 | Exceptional 67.1% |
| Immigrants | Afghanistan | 100.0 /100 | #37 | Exceptional 67.0% |
| Immigrants | Nigeria | 100.0 /100 | #38 | Exceptional 66.9% |
Demographics Similar to West Indians by In Labor Force | Age > 16
In terms of in labor force | age > 16, the demographic groups most similar to West Indians are Tsimshian (64.5%, a difference of 0.0%), Immigrants from Lebanon (64.5%, a difference of 0.020%), Immigrants from Netherlands (64.5%, a difference of 0.030%), Immigrants from Dominica (64.5%, a difference of 0.040%), and Immigrants from Bangladesh (64.5%, a difference of 0.050%).
| Demographics | Rating | Rank | In Labor Force | Age > 16 |
| Lebanese | 3.9 /100 | #238 | Tragic 64.5% |
| Immigrants | Hungary | 3.8 /100 | #239 | Tragic 64.5% |
| Immigrants | Bangladesh | 3.6 /100 | #240 | Tragic 64.5% |
| Immigrants | Dominica | 3.5 /100 | #241 | Tragic 64.5% |
| Immigrants | Netherlands | 3.4 /100 | #242 | Tragic 64.5% |
| Immigrants | Lebanon | 3.2 /100 | #243 | Tragic 64.5% |
| Tsimshian | 3.1 /100 | #244 | Tragic 64.5% |
| West Indians | 3.0 /100 | #245 | Tragic 64.5% |
| Immigrants | Caribbean | 2.3 /100 | #246 | Tragic 64.4% |
| Swiss | 2.1 /100 | #247 | Tragic 64.4% |
| Immigrants | Barbados | 2.1 /100 | #248 | Tragic 64.4% |
| Germans | 1.8 /100 | #249 | Tragic 64.4% |
| British West Indians | 1.8 /100 | #250 | Tragic 64.4% |
| Portuguese | 1.6 /100 | #251 | Tragic 64.4% |
| Immigrants | Dominican Republic | 1.5 /100 | #252 | Tragic 64.4% |