Immigrants from Ethiopia vs West Indian High School Diploma
COMPARE
Immigrants from Ethiopia
West Indian
High School Diploma
High School Diploma Comparison
Immigrants from Ethiopia
West Indians
88.9%
HIGH SCHOOL DIPLOMA
30.9/ 100
METRIC RATING
191st/ 347
METRIC RANK
86.9%
HIGH SCHOOL DIPLOMA
0.1/ 100
METRIC RATING
271st/ 347
METRIC RANK
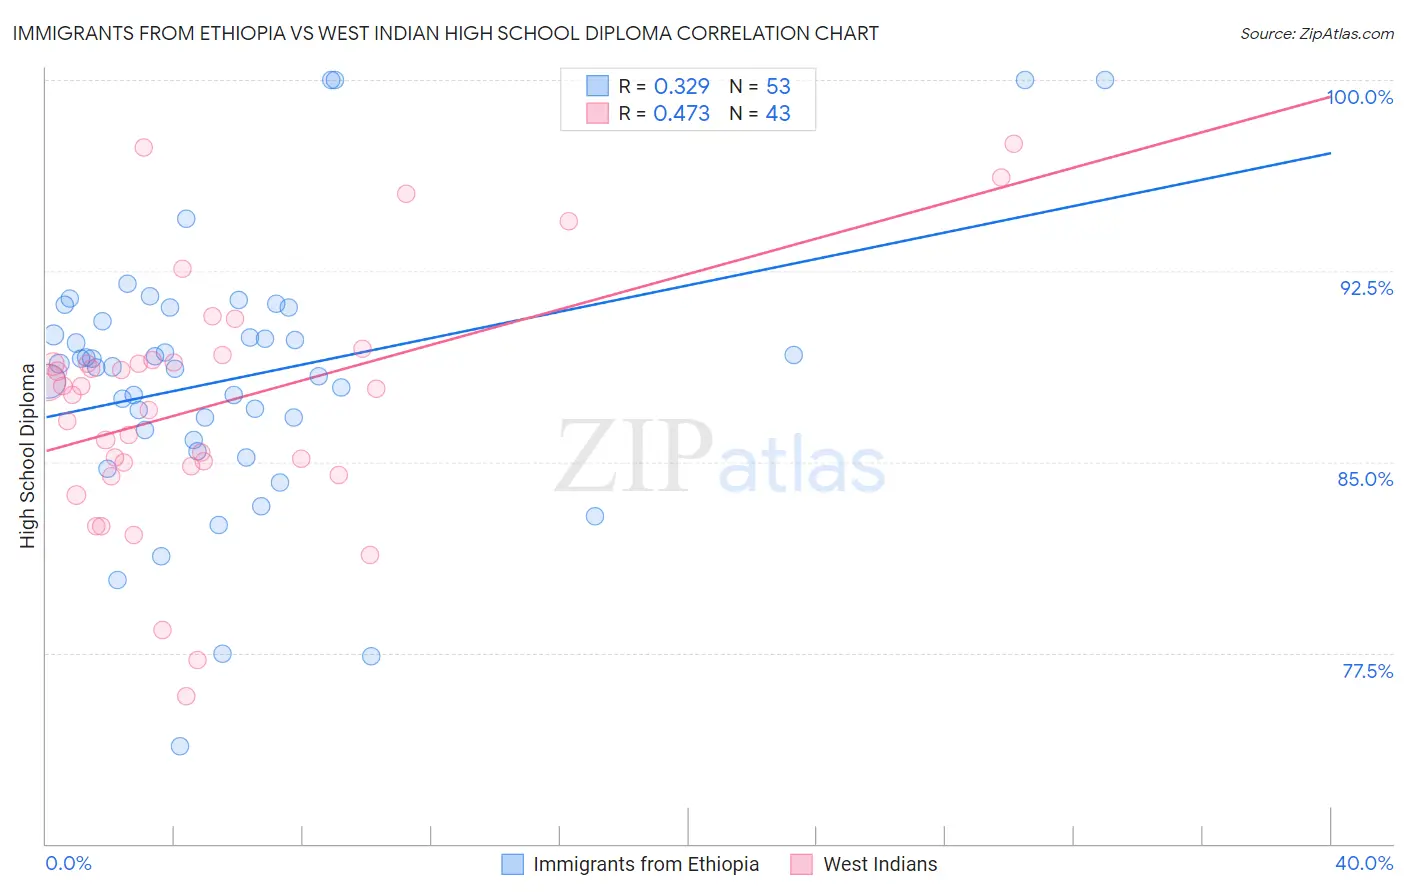
Immigrants from Ethiopia vs West Indian High School Diploma Correlation Chart
The statistical analysis conducted on geographies consisting of 211,528,629 people shows a mild positive correlation between the proportion of Immigrants from Ethiopia and percentage of population with at least high school diploma education in the United States with a correlation coefficient (R) of 0.329 and weighted average of 88.9%. Similarly, the statistical analysis conducted on geographies consisting of 254,059,006 people shows a moderate positive correlation between the proportion of West Indians and percentage of population with at least high school diploma education in the United States with a correlation coefficient (R) of 0.473 and weighted average of 86.9%, a difference of 2.2%.
High School Diploma Correlation Summary
| Measurement | Immigrants from Ethiopia | West Indian |
| Minimum | 73.8% | 75.8% |
| Maximum | 100.0% | 97.5% |
| Range | 26.2% | 21.7% |
| Mean | 88.3% | 87.3% |
| Median | 88.7% | 87.9% |
| Interquartile 25% (IQ1) | 86.1% | 84.8% |
| Interquartile 75% (IQ3) | 90.8% | 89.0% |
| Interquartile Range (IQR) | 4.7% | 4.2% |
| Standard Deviation (Sample) | 5.2% | 4.8% |
| Standard Deviation (Population) | 5.1% | 4.7% |
Similar Demographics by High School Diploma
Demographics Similar to Immigrants from Ethiopia by High School Diploma
In terms of high school diploma, the demographic groups most similar to Immigrants from Ethiopia are Immigrants from Chile (88.9%, a difference of 0.020%), Moroccan (88.8%, a difference of 0.020%), Immigrants from Uganda (88.9%, a difference of 0.030%), Immigrants from Sudan (88.9%, a difference of 0.040%), and Immigrants from Oceania (88.8%, a difference of 0.070%).
| Demographics | Rating | Rank | High School Diploma |
| Immigrants | Syria | 39.2 /100 | #184 | Fair 89.0% |
| Ethiopians | 37.0 /100 | #185 | Fair 89.0% |
| Immigrants | Eastern Africa | 35.8 /100 | #186 | Fair 88.9% |
| Guamanians/Chamorros | 35.5 /100 | #187 | Fair 88.9% |
| Immigrants | Sudan | 33.4 /100 | #188 | Fair 88.9% |
| Immigrants | Uganda | 32.6 /100 | #189 | Fair 88.9% |
| Immigrants | Chile | 31.9 /100 | #190 | Fair 88.9% |
| Immigrants | Ethiopia | 30.9 /100 | #191 | Fair 88.9% |
| Moroccans | 29.5 /100 | #192 | Fair 88.8% |
| Immigrants | Oceania | 26.9 /100 | #193 | Fair 88.8% |
| Immigrants | Venezuela | 25.8 /100 | #194 | Fair 88.8% |
| Afghans | 23.9 /100 | #195 | Fair 88.8% |
| Immigrants | Southern Europe | 23.4 /100 | #196 | Fair 88.7% |
| French American Indians | 21.5 /100 | #197 | Fair 88.7% |
| Liberians | 18.8 /100 | #198 | Poor 88.7% |
Demographics Similar to West Indians by High School Diploma
In terms of high school diploma, the demographic groups most similar to West Indians are Trinidadian and Tobagonian (86.9%, a difference of 0.010%), Immigrants from Jamaica (86.9%, a difference of 0.040%), Bangladeshi (86.9%, a difference of 0.050%), Malaysian (87.0%, a difference of 0.070%), and Sri Lankan (87.0%, a difference of 0.080%).
| Demographics | Rating | Rank | High School Diploma |
| Jamaicans | 0.3 /100 | #264 | Tragic 87.2% |
| U.S. Virgin Islanders | 0.2 /100 | #265 | Tragic 87.1% |
| Immigrants | Congo | 0.2 /100 | #266 | Tragic 87.0% |
| Blacks/African Americans | 0.2 /100 | #267 | Tragic 87.0% |
| Pennsylvania Germans | 0.2 /100 | #268 | Tragic 87.0% |
| Sri Lankans | 0.2 /100 | #269 | Tragic 87.0% |
| Malaysians | 0.2 /100 | #270 | Tragic 87.0% |
| West Indians | 0.1 /100 | #271 | Tragic 86.9% |
| Trinidadians and Tobagonians | 0.1 /100 | #272 | Tragic 86.9% |
| Immigrants | Jamaica | 0.1 /100 | #273 | Tragic 86.9% |
| Bangladeshis | 0.1 /100 | #274 | Tragic 86.9% |
| Immigrants | Trinidad and Tobago | 0.1 /100 | #275 | Tragic 86.8% |
| Immigrants | Burma/Myanmar | 0.1 /100 | #276 | Tragic 86.7% |
| Barbadians | 0.1 /100 | #277 | Tragic 86.7% |
| Hopi | 0.1 /100 | #278 | Tragic 86.6% |