Creek vs West Indian High School Diploma
COMPARE
Creek
West Indian
High School Diploma
High School Diploma Comparison
Creek
West Indians
88.3%
HIGH SCHOOL DIPLOMA
6.9/ 100
METRIC RATING
225th/ 347
METRIC RANK
86.9%
HIGH SCHOOL DIPLOMA
0.1/ 100
METRIC RATING
271st/ 347
METRIC RANK
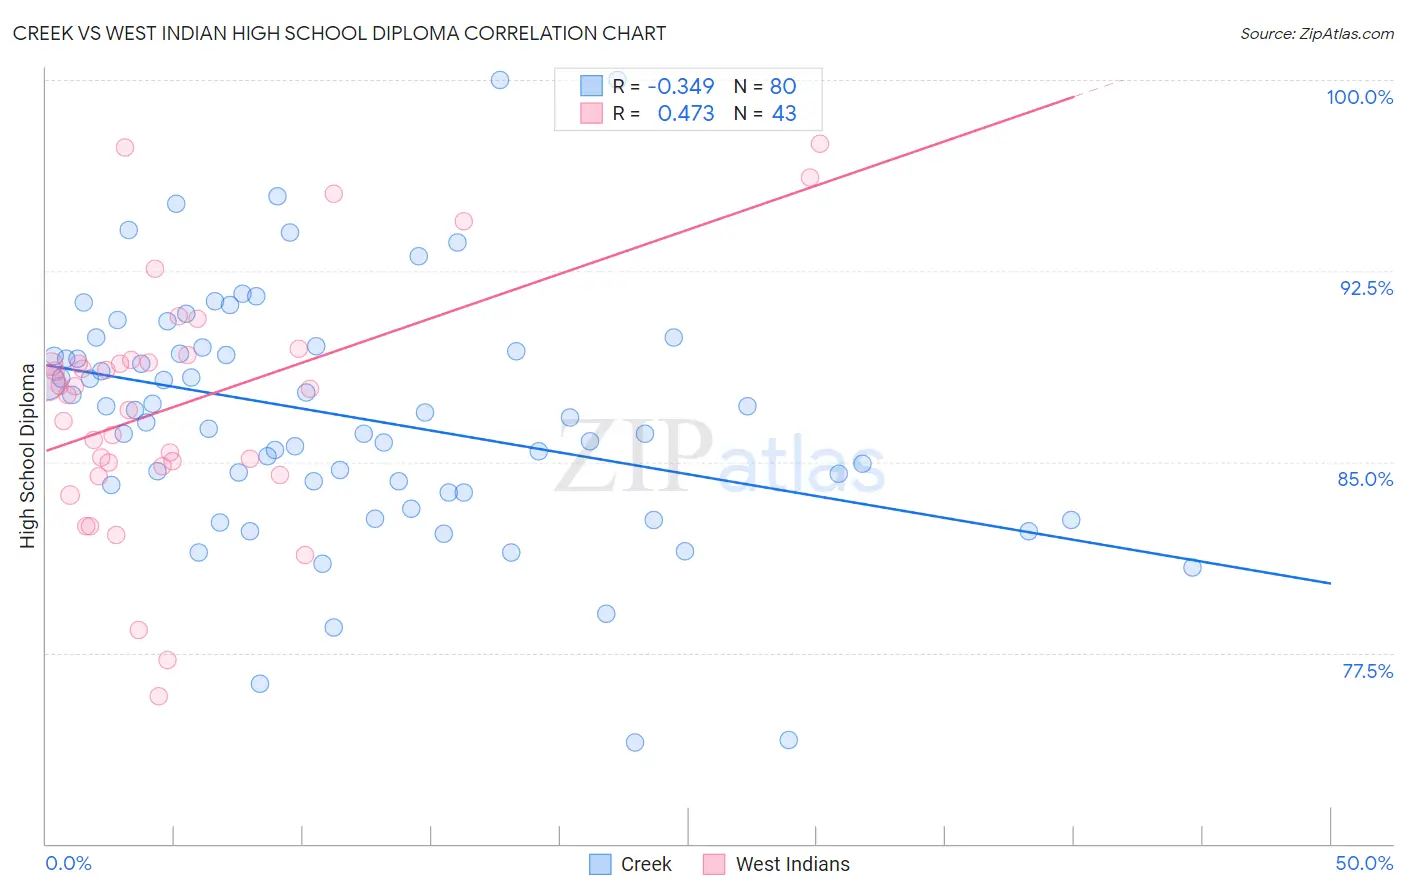
Creek vs West Indian High School Diploma Correlation Chart
The statistical analysis conducted on geographies consisting of 178,480,629 people shows a mild negative correlation between the proportion of Creek and percentage of population with at least high school diploma education in the United States with a correlation coefficient (R) of -0.349 and weighted average of 88.3%. Similarly, the statistical analysis conducted on geographies consisting of 254,059,006 people shows a moderate positive correlation between the proportion of West Indians and percentage of population with at least high school diploma education in the United States with a correlation coefficient (R) of 0.473 and weighted average of 86.9%, a difference of 1.5%.
High School Diploma Correlation Summary
| Measurement | Creek | West Indian |
| Minimum | 74.0% | 75.8% |
| Maximum | 100.0% | 97.5% |
| Range | 26.0% | 21.7% |
| Mean | 86.8% | 87.3% |
| Median | 86.8% | 87.9% |
| Interquartile 25% (IQ1) | 83.9% | 84.8% |
| Interquartile 75% (IQ3) | 89.4% | 89.0% |
| Interquartile Range (IQR) | 5.5% | 4.2% |
| Standard Deviation (Sample) | 4.8% | 4.8% |
| Standard Deviation (Population) | 4.8% | 4.7% |
Similar Demographics by High School Diploma
Demographics Similar to Creek by High School Diploma
In terms of high school diploma, the demographic groups most similar to Creek are Shoshone (88.3%, a difference of 0.010%), Immigrants from Zaire (88.3%, a difference of 0.040%), Colville (88.3%, a difference of 0.050%), Uruguayan (88.2%, a difference of 0.080%), and Immigrants from Afghanistan (88.3%, a difference of 0.090%).
| Demographics | Rating | Rank | High School Diploma |
| Immigrants | Bolivia | 10.3 /100 | #218 | Poor 88.4% |
| Costa Ricans | 9.6 /100 | #219 | Tragic 88.4% |
| Tongans | 9.5 /100 | #220 | Tragic 88.4% |
| Immigrants | Afghanistan | 8.6 /100 | #221 | Tragic 88.3% |
| Colville | 7.8 /100 | #222 | Tragic 88.3% |
| Immigrants | Zaire | 7.6 /100 | #223 | Tragic 88.3% |
| Shoshone | 7.0 /100 | #224 | Tragic 88.3% |
| Creek | 6.9 /100 | #225 | Tragic 88.3% |
| Uruguayans | 5.6 /100 | #226 | Tragic 88.2% |
| Immigrants | Liberia | 5.5 /100 | #227 | Tragic 88.2% |
| Kiowa | 5.3 /100 | #228 | Tragic 88.2% |
| Nigerians | 5.2 /100 | #229 | Tragic 88.2% |
| Blackfeet | 4.2 /100 | #230 | Tragic 88.1% |
| Colombians | 3.8 /100 | #231 | Tragic 88.1% |
| Immigrants | Middle Africa | 3.4 /100 | #232 | Tragic 88.0% |
Demographics Similar to West Indians by High School Diploma
In terms of high school diploma, the demographic groups most similar to West Indians are Trinidadian and Tobagonian (86.9%, a difference of 0.010%), Immigrants from Jamaica (86.9%, a difference of 0.040%), Bangladeshi (86.9%, a difference of 0.050%), Malaysian (87.0%, a difference of 0.070%), and Sri Lankan (87.0%, a difference of 0.080%).
| Demographics | Rating | Rank | High School Diploma |
| Jamaicans | 0.3 /100 | #264 | Tragic 87.2% |
| U.S. Virgin Islanders | 0.2 /100 | #265 | Tragic 87.1% |
| Immigrants | Congo | 0.2 /100 | #266 | Tragic 87.0% |
| Blacks/African Americans | 0.2 /100 | #267 | Tragic 87.0% |
| Pennsylvania Germans | 0.2 /100 | #268 | Tragic 87.0% |
| Sri Lankans | 0.2 /100 | #269 | Tragic 87.0% |
| Malaysians | 0.2 /100 | #270 | Tragic 87.0% |
| West Indians | 0.1 /100 | #271 | Tragic 86.9% |
| Trinidadians and Tobagonians | 0.1 /100 | #272 | Tragic 86.9% |
| Immigrants | Jamaica | 0.1 /100 | #273 | Tragic 86.9% |
| Bangladeshis | 0.1 /100 | #274 | Tragic 86.9% |
| Immigrants | Trinidad and Tobago | 0.1 /100 | #275 | Tragic 86.8% |
| Immigrants | Burma/Myanmar | 0.1 /100 | #276 | Tragic 86.7% |
| Barbadians | 0.1 /100 | #277 | Tragic 86.7% |
| Hopi | 0.1 /100 | #278 | Tragic 86.6% |