Asian vs West Indian High School Diploma
COMPARE
Asian
West Indian
High School Diploma
High School Diploma Comparison
Asians
West Indians
89.4%
HIGH SCHOOL DIPLOMA
70.7/ 100
METRIC RATING
152nd/ 347
METRIC RANK
86.9%
HIGH SCHOOL DIPLOMA
0.1/ 100
METRIC RATING
271st/ 347
METRIC RANK
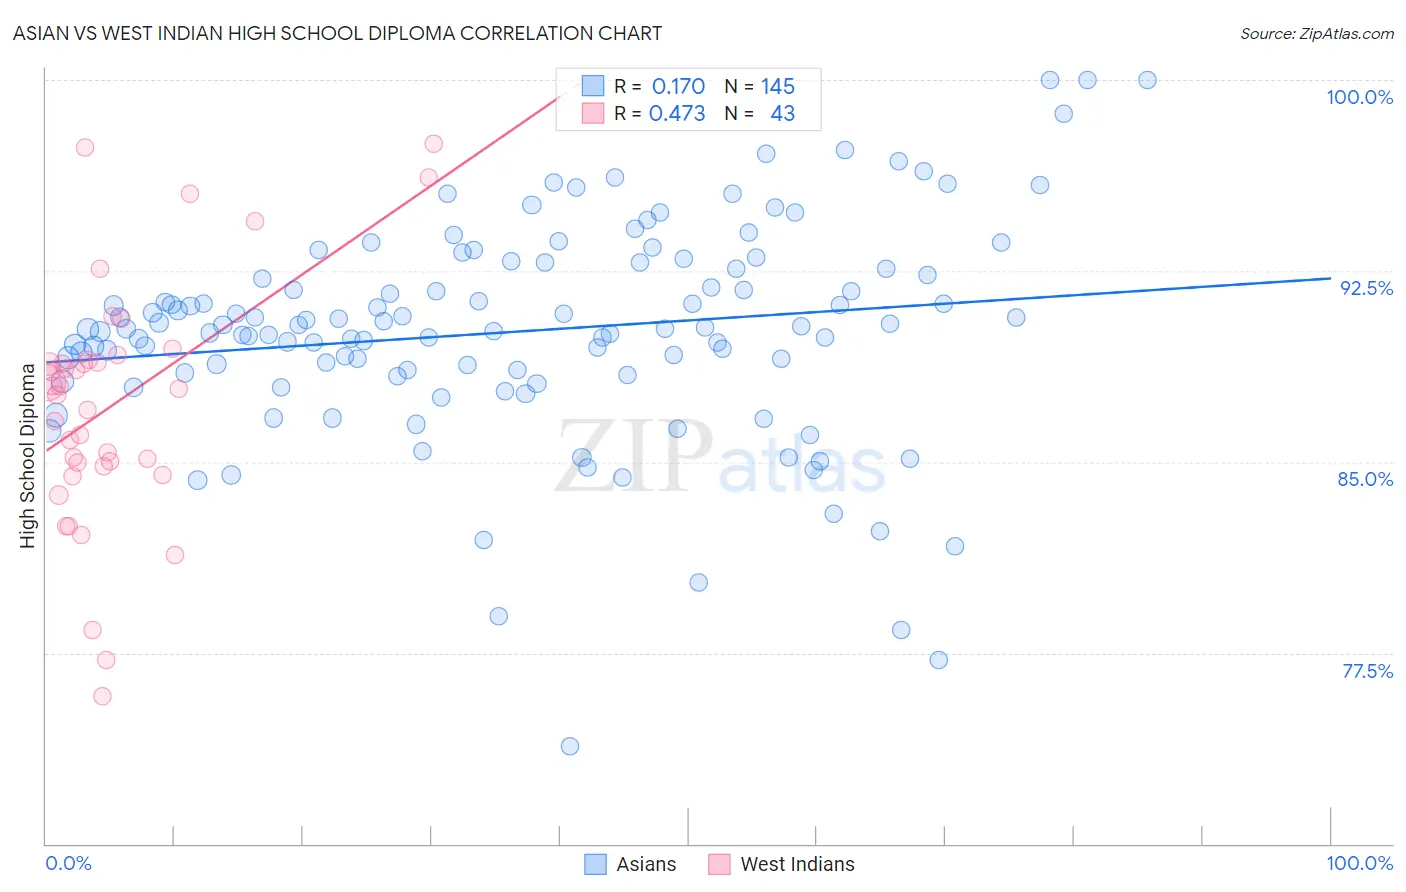
Asian vs West Indian High School Diploma Correlation Chart
The statistical analysis conducted on geographies consisting of 550,718,935 people shows a poor positive correlation between the proportion of Asians and percentage of population with at least high school diploma education in the United States with a correlation coefficient (R) of 0.170 and weighted average of 89.4%. Similarly, the statistical analysis conducted on geographies consisting of 254,059,006 people shows a moderate positive correlation between the proportion of West Indians and percentage of population with at least high school diploma education in the United States with a correlation coefficient (R) of 0.473 and weighted average of 86.9%, a difference of 2.9%.
High School Diploma Correlation Summary
| Measurement | Asian | West Indian |
| Minimum | 73.8% | 75.8% |
| Maximum | 100.0% | 97.5% |
| Range | 26.2% | 21.7% |
| Mean | 90.1% | 87.3% |
| Median | 90.2% | 87.9% |
| Interquartile 25% (IQ1) | 88.5% | 84.8% |
| Interquartile 75% (IQ3) | 92.6% | 89.0% |
| Interquartile Range (IQR) | 4.1% | 4.2% |
| Standard Deviation (Sample) | 4.2% | 4.8% |
| Standard Deviation (Population) | 4.2% | 4.7% |
Similar Demographics by High School Diploma
Demographics Similar to Asians by High School Diploma
In terms of high school diploma, the demographic groups most similar to Asians are Paraguayan (89.5%, a difference of 0.010%), Argentinean (89.5%, a difference of 0.030%), Immigrants from Poland (89.5%, a difference of 0.040%), Immigrants from Iraq (89.4%, a difference of 0.040%), and Immigrants from Lebanon (89.5%, a difference of 0.050%).
| Demographics | Rating | Rank | High School Diploma |
| Immigrants | Brazil | 76.6 /100 | #145 | Good 89.5% |
| Immigrants | Spain | 76.2 /100 | #146 | Good 89.5% |
| Iraqis | 73.9 /100 | #147 | Good 89.5% |
| Immigrants | Lebanon | 73.4 /100 | #148 | Good 89.5% |
| Immigrants | Poland | 72.9 /100 | #149 | Good 89.5% |
| Argentineans | 72.3 /100 | #150 | Good 89.5% |
| Paraguayans | 71.4 /100 | #151 | Good 89.5% |
| Asians | 70.7 /100 | #152 | Good 89.4% |
| Immigrants | Iraq | 68.7 /100 | #153 | Good 89.4% |
| Alsatians | 66.8 /100 | #154 | Good 89.4% |
| Immigrants | Northern Africa | 66.4 /100 | #155 | Good 89.4% |
| Immigrants | Argentina | 65.5 /100 | #156 | Good 89.4% |
| Immigrants | Malaysia | 63.5 /100 | #157 | Good 89.3% |
| Immigrants | Pakistan | 62.5 /100 | #158 | Good 89.3% |
| Immigrants | China | 62.0 /100 | #159 | Good 89.3% |
Demographics Similar to West Indians by High School Diploma
In terms of high school diploma, the demographic groups most similar to West Indians are Trinidadian and Tobagonian (86.9%, a difference of 0.010%), Immigrants from Jamaica (86.9%, a difference of 0.040%), Bangladeshi (86.9%, a difference of 0.050%), Malaysian (87.0%, a difference of 0.070%), and Sri Lankan (87.0%, a difference of 0.080%).
| Demographics | Rating | Rank | High School Diploma |
| Jamaicans | 0.3 /100 | #264 | Tragic 87.2% |
| U.S. Virgin Islanders | 0.2 /100 | #265 | Tragic 87.1% |
| Immigrants | Congo | 0.2 /100 | #266 | Tragic 87.0% |
| Blacks/African Americans | 0.2 /100 | #267 | Tragic 87.0% |
| Pennsylvania Germans | 0.2 /100 | #268 | Tragic 87.0% |
| Sri Lankans | 0.2 /100 | #269 | Tragic 87.0% |
| Malaysians | 0.2 /100 | #270 | Tragic 87.0% |
| West Indians | 0.1 /100 | #271 | Tragic 86.9% |
| Trinidadians and Tobagonians | 0.1 /100 | #272 | Tragic 86.9% |
| Immigrants | Jamaica | 0.1 /100 | #273 | Tragic 86.9% |
| Bangladeshis | 0.1 /100 | #274 | Tragic 86.9% |
| Immigrants | Trinidad and Tobago | 0.1 /100 | #275 | Tragic 86.8% |
| Immigrants | Burma/Myanmar | 0.1 /100 | #276 | Tragic 86.7% |
| Barbadians | 0.1 /100 | #277 | Tragic 86.7% |
| Hopi | 0.1 /100 | #278 | Tragic 86.6% |