Ghanaian vs West Indian 11th Grade
COMPARE
Ghanaian
West Indian
11th Grade
11th Grade Comparison
Ghanaians
West Indians
91.5%
11TH GRADE
0.9/ 100
METRIC RATING
250th/ 347
METRIC RANK
91.0%
11TH GRADE
0.1/ 100
METRIC RATING
272nd/ 347
METRIC RANK
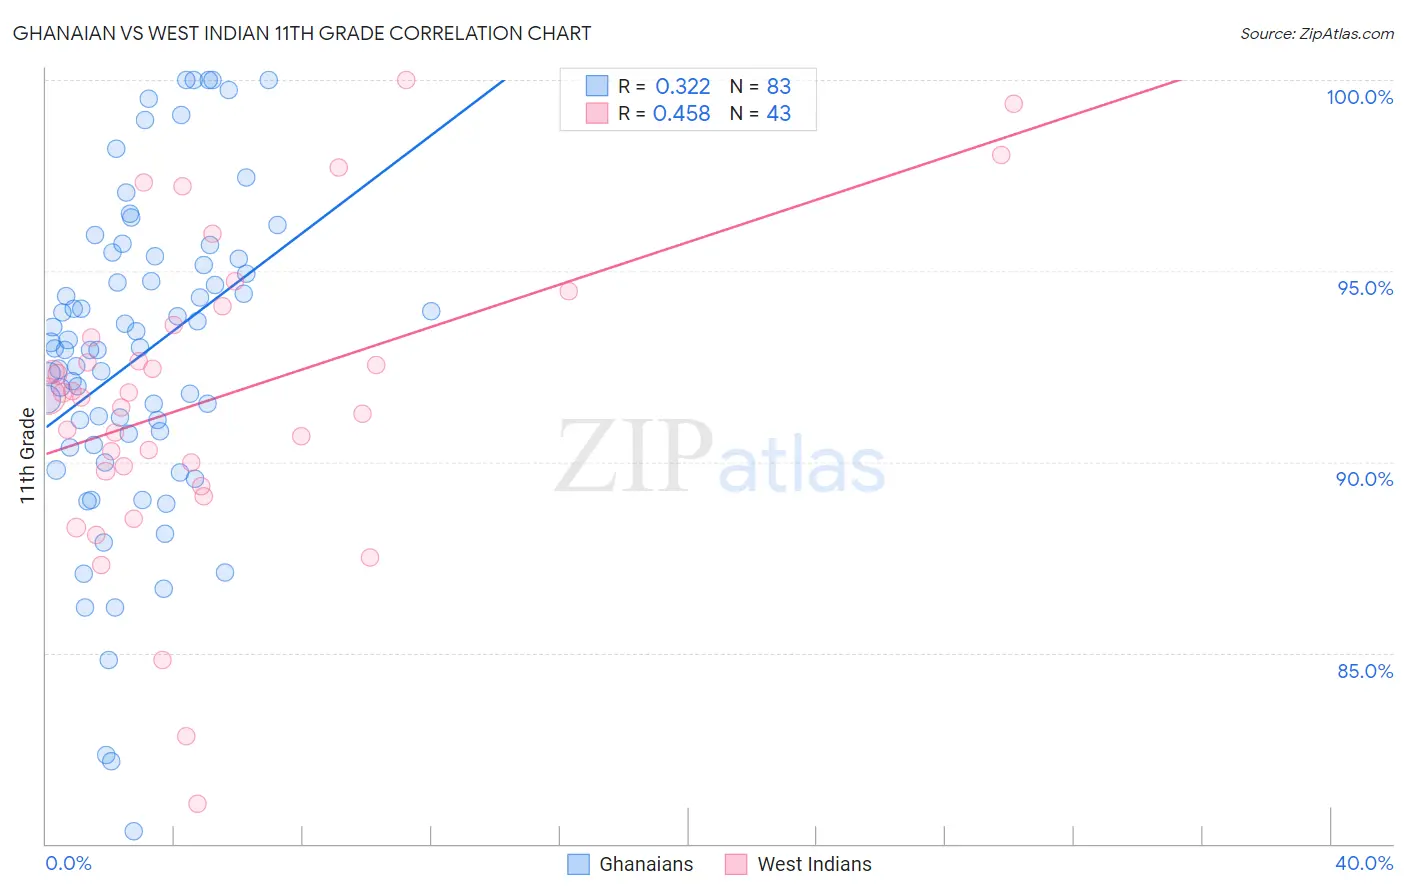
Ghanaian vs West Indian 11th Grade Correlation Chart
The statistical analysis conducted on geographies consisting of 190,714,079 people shows a mild positive correlation between the proportion of Ghanaians and percentage of population with at least 11th grade education in the United States with a correlation coefficient (R) of 0.322 and weighted average of 91.5%. Similarly, the statistical analysis conducted on geographies consisting of 254,059,006 people shows a moderate positive correlation between the proportion of West Indians and percentage of population with at least 11th grade education in the United States with a correlation coefficient (R) of 0.458 and weighted average of 91.0%, a difference of 0.48%.
11th Grade Correlation Summary
| Measurement | Ghanaian | West Indian |
| Minimum | 80.3% | 81.1% |
| Maximum | 100.0% | 100.0% |
| Range | 19.7% | 18.9% |
| Mean | 92.7% | 91.7% |
| Median | 93.0% | 91.7% |
| Interquartile 25% (IQ1) | 90.4% | 89.7% |
| Interquartile 75% (IQ3) | 95.3% | 93.6% |
| Interquartile Range (IQR) | 4.9% | 3.8% |
| Standard Deviation (Sample) | 4.2% | 4.0% |
| Standard Deviation (Population) | 4.2% | 3.9% |
Similar Demographics by 11th Grade
Demographics Similar to Ghanaians by 11th Grade
In terms of 11th grade, the demographic groups most similar to Ghanaians are Peruvian (91.5%, a difference of 0.0%), Immigrants from Philippines (91.5%, a difference of 0.010%), Immigrants from Uzbekistan (91.5%, a difference of 0.010%), Immigrants from Costa Rica (91.4%, a difference of 0.020%), and Immigrants from Nigeria (91.4%, a difference of 0.030%).
| Demographics | Rating | Rank | 11th Grade |
| Immigrants | Thailand | 1.4 /100 | #243 | Tragic 91.6% |
| Senegalese | 1.4 /100 | #244 | Tragic 91.6% |
| Africans | 1.3 /100 | #245 | Tragic 91.5% |
| Seminole | 1.2 /100 | #246 | Tragic 91.5% |
| Immigrants | Philippines | 1.0 /100 | #247 | Tragic 91.5% |
| Immigrants | Uzbekistan | 1.0 /100 | #248 | Tragic 91.5% |
| Peruvians | 1.0 /100 | #249 | Tragic 91.5% |
| Ghanaians | 0.9 /100 | #250 | Tragic 91.5% |
| Immigrants | Costa Rica | 0.9 /100 | #251 | Tragic 91.4% |
| Immigrants | Nigeria | 0.8 /100 | #252 | Tragic 91.4% |
| Immigrants | South America | 0.8 /100 | #253 | Tragic 91.4% |
| Immigrants | Eritrea | 0.7 /100 | #254 | Tragic 91.4% |
| Blacks/African Americans | 0.7 /100 | #255 | Tragic 91.4% |
| Immigrants | Senegal | 0.7 /100 | #256 | Tragic 91.4% |
| Cajuns | 0.7 /100 | #257 | Tragic 91.4% |
Demographics Similar to West Indians by 11th Grade
In terms of 11th grade, the demographic groups most similar to West Indians are Immigrants from Peru (91.0%, a difference of 0.0%), Trinidadian and Tobagonian (91.1%, a difference of 0.040%), Paiute (91.0%, a difference of 0.050%), Ute (91.1%, a difference of 0.060%), and U.S. Virgin Islander (91.1%, a difference of 0.090%).
| Demographics | Rating | Rank | 11th Grade |
| Pueblo | 0.3 /100 | #265 | Tragic 91.2% |
| Immigrants | Western Africa | 0.3 /100 | #266 | Tragic 91.2% |
| Immigrants | Jamaica | 0.3 /100 | #267 | Tragic 91.2% |
| U.S. Virgin Islanders | 0.2 /100 | #268 | Tragic 91.1% |
| Ute | 0.2 /100 | #269 | Tragic 91.1% |
| Trinidadians and Tobagonians | 0.2 /100 | #270 | Tragic 91.1% |
| Immigrants | Peru | 0.1 /100 | #271 | Tragic 91.0% |
| West Indians | 0.1 /100 | #272 | Tragic 91.0% |
| Paiute | 0.1 /100 | #273 | Tragic 91.0% |
| Immigrants | Trinidad and Tobago | 0.1 /100 | #274 | Tragic 90.9% |
| Immigrants | South Eastern Asia | 0.1 /100 | #275 | Tragic 90.9% |
| Bangladeshis | 0.1 /100 | #276 | Tragic 90.9% |
| Immigrants | Congo | 0.1 /100 | #277 | Tragic 90.9% |
| Malaysians | 0.1 /100 | #278 | Tragic 90.8% |
| Barbadians | 0.0 /100 | #279 | Tragic 90.8% |