South African vs West Indian High School Diploma
COMPARE
South African
West Indian
High School Diploma
High School Diploma Comparison
South Africans
West Indians
90.6%
HIGH SCHOOL DIPLOMA
98.6/ 100
METRIC RATING
91st/ 347
METRIC RANK
86.9%
HIGH SCHOOL DIPLOMA
0.1/ 100
METRIC RATING
271st/ 347
METRIC RANK
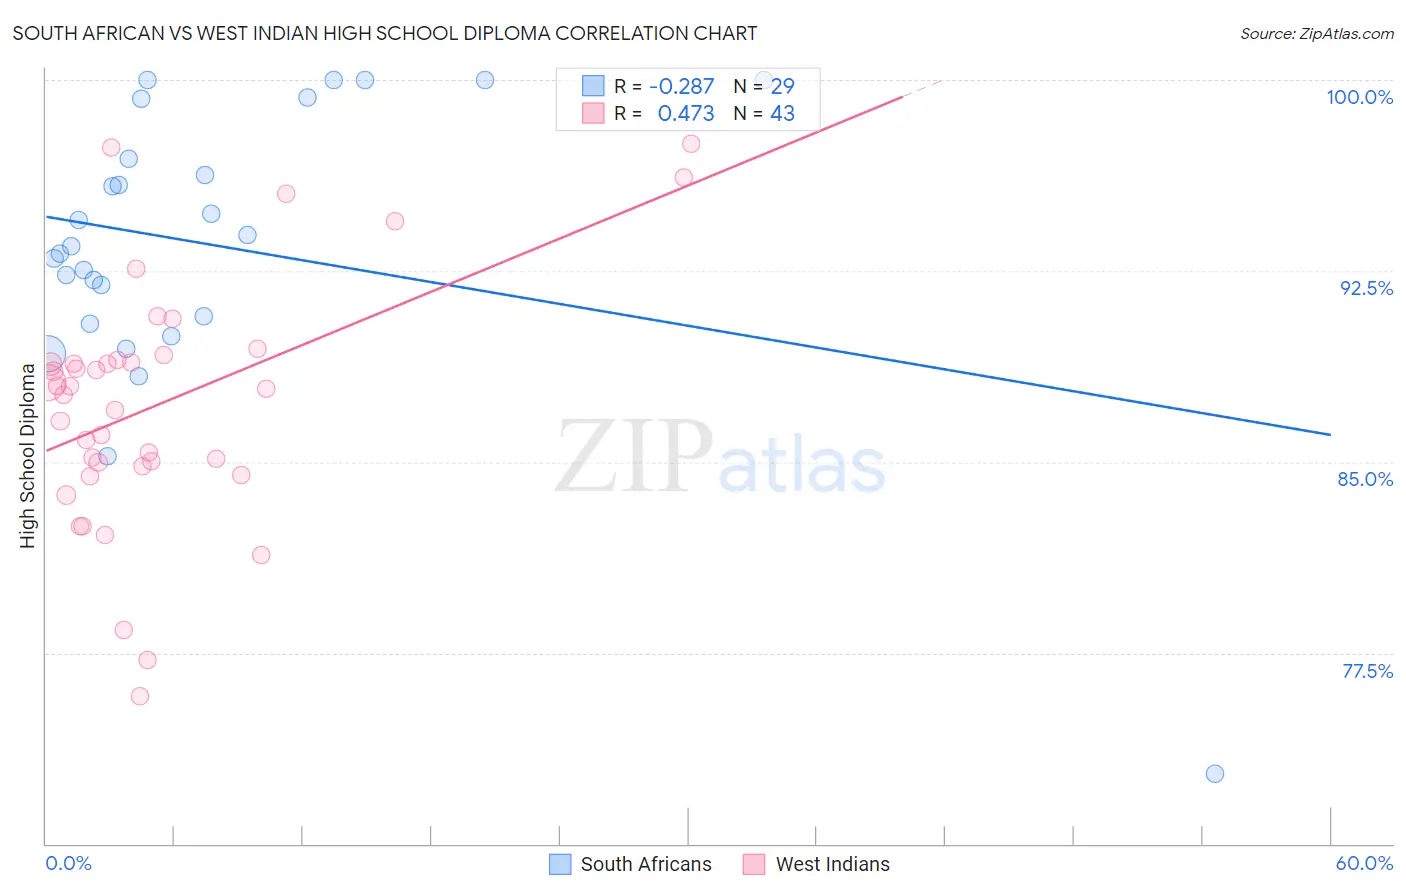
South African vs West Indian High School Diploma Correlation Chart
The statistical analysis conducted on geographies consisting of 182,604,532 people shows a weak negative correlation between the proportion of South Africans and percentage of population with at least high school diploma education in the United States with a correlation coefficient (R) of -0.287 and weighted average of 90.6%. Similarly, the statistical analysis conducted on geographies consisting of 254,059,006 people shows a moderate positive correlation between the proportion of West Indians and percentage of population with at least high school diploma education in the United States with a correlation coefficient (R) of 0.473 and weighted average of 86.9%, a difference of 4.2%.
High School Diploma Correlation Summary
| Measurement | South African | West Indian |
| Minimum | 72.7% | 75.8% |
| Maximum | 100.0% | 97.5% |
| Range | 27.3% | 21.7% |
| Mean | 93.5% | 87.3% |
| Median | 93.5% | 87.9% |
| Interquartile 25% (IQ1) | 90.6% | 84.8% |
| Interquartile 75% (IQ3) | 98.1% | 89.0% |
| Interquartile Range (IQR) | 7.5% | 4.2% |
| Standard Deviation (Sample) | 5.7% | 4.8% |
| Standard Deviation (Population) | 5.6% | 4.7% |
Similar Demographics by High School Diploma
Demographics Similar to South Africans by High School Diploma
In terms of high school diploma, the demographic groups most similar to South Africans are Swiss (90.6%, a difference of 0.010%), Celtic (90.6%, a difference of 0.020%), Immigrants from Western Europe (90.6%, a difference of 0.020%), Canadian (90.6%, a difference of 0.030%), and Immigrants from Israel (90.5%, a difference of 0.040%).
| Demographics | Rating | Rank | High School Diploma |
| Immigrants | Saudi Arabia | 99.1 /100 | #84 | Exceptional 90.7% |
| Romanians | 98.9 /100 | #85 | Exceptional 90.7% |
| Immigrants | Bulgaria | 98.9 /100 | #86 | Exceptional 90.6% |
| Immigrants | Turkey | 98.9 /100 | #87 | Exceptional 90.6% |
| Immigrants | France | 98.8 /100 | #88 | Exceptional 90.6% |
| Canadians | 98.7 /100 | #89 | Exceptional 90.6% |
| Celtics | 98.7 /100 | #90 | Exceptional 90.6% |
| South Africans | 98.6 /100 | #91 | Exceptional 90.6% |
| Swiss | 98.6 /100 | #92 | Exceptional 90.6% |
| Immigrants | Western Europe | 98.6 /100 | #93 | Exceptional 90.6% |
| Immigrants | Israel | 98.5 /100 | #94 | Exceptional 90.5% |
| Icelanders | 98.5 /100 | #95 | Exceptional 90.5% |
| Immigrants | Serbia | 98.4 /100 | #96 | Exceptional 90.5% |
| Immigrants | Kuwait | 98.3 /100 | #97 | Exceptional 90.5% |
| Immigrants | Korea | 98.3 /100 | #98 | Exceptional 90.5% |
Demographics Similar to West Indians by High School Diploma
In terms of high school diploma, the demographic groups most similar to West Indians are Trinidadian and Tobagonian (86.9%, a difference of 0.010%), Immigrants from Jamaica (86.9%, a difference of 0.040%), Bangladeshi (86.9%, a difference of 0.050%), Malaysian (87.0%, a difference of 0.070%), and Sri Lankan (87.0%, a difference of 0.080%).
| Demographics | Rating | Rank | High School Diploma |
| Jamaicans | 0.3 /100 | #264 | Tragic 87.2% |
| U.S. Virgin Islanders | 0.2 /100 | #265 | Tragic 87.1% |
| Immigrants | Congo | 0.2 /100 | #266 | Tragic 87.0% |
| Blacks/African Americans | 0.2 /100 | #267 | Tragic 87.0% |
| Pennsylvania Germans | 0.2 /100 | #268 | Tragic 87.0% |
| Sri Lankans | 0.2 /100 | #269 | Tragic 87.0% |
| Malaysians | 0.2 /100 | #270 | Tragic 87.0% |
| West Indians | 0.1 /100 | #271 | Tragic 86.9% |
| Trinidadians and Tobagonians | 0.1 /100 | #272 | Tragic 86.9% |
| Immigrants | Jamaica | 0.1 /100 | #273 | Tragic 86.9% |
| Bangladeshis | 0.1 /100 | #274 | Tragic 86.9% |
| Immigrants | Trinidad and Tobago | 0.1 /100 | #275 | Tragic 86.8% |
| Immigrants | Burma/Myanmar | 0.1 /100 | #276 | Tragic 86.7% |
| Barbadians | 0.1 /100 | #277 | Tragic 86.7% |
| Hopi | 0.1 /100 | #278 | Tragic 86.6% |