French vs Lumbee Single Mother Households
COMPARE
French
Lumbee
Single Mother Households
Single Mother Households Comparison
French
Lumbee
6.0%
SINGLE MOTHER HOUSEHOLDS
85.7/ 100
METRIC RATING
140th/ 347
METRIC RANK
9.1%
SINGLE MOTHER HOUSEHOLDS
0.0/ 100
METRIC RATING
340th/ 347
METRIC RANK
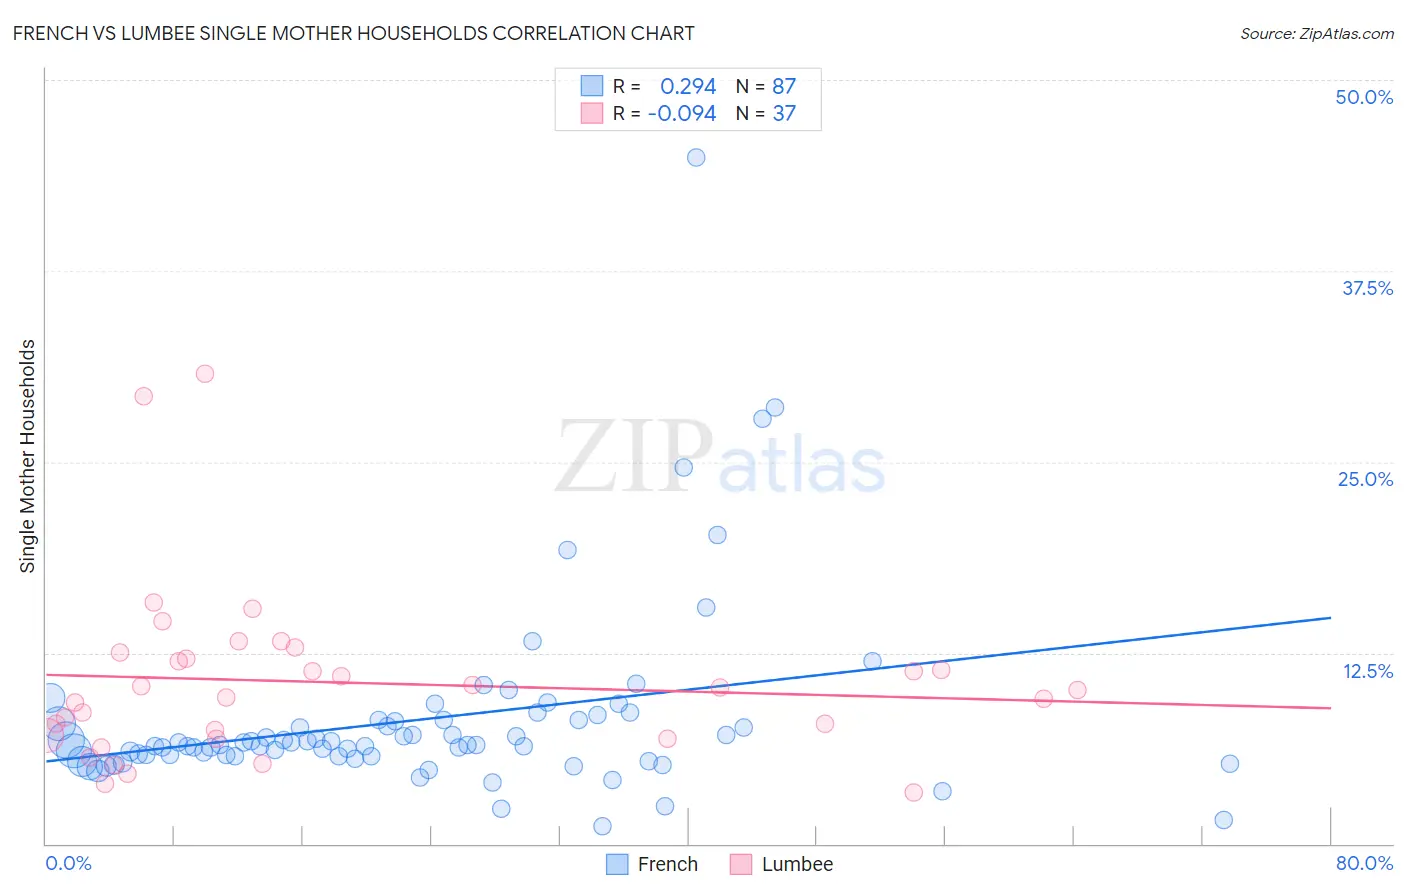
French vs Lumbee Single Mother Households Correlation Chart
The statistical analysis conducted on geographies consisting of 566,908,036 people shows a weak positive correlation between the proportion of French and percentage of single mother households in the United States with a correlation coefficient (R) of 0.294 and weighted average of 6.0%. Similarly, the statistical analysis conducted on geographies consisting of 92,236,041 people shows a slight negative correlation between the proportion of Lumbee and percentage of single mother households in the United States with a correlation coefficient (R) of -0.094 and weighted average of 9.1%, a difference of 51.6%.
Single Mother Households Correlation Summary
| Measurement | French | Lumbee |
| Minimum | 1.2% | 3.3% |
| Maximum | 44.9% | 30.7% |
| Range | 43.7% | 27.4% |
| Mean | 8.1% | 10.6% |
| Median | 6.5% | 10.0% |
| Interquartile 25% (IQ1) | 5.8% | 7.0% |
| Interquartile 75% (IQ3) | 8.1% | 12.3% |
| Interquartile Range (IQR) | 2.3% | 5.3% |
| Standard Deviation (Sample) | 6.2% | 5.7% |
| Standard Deviation (Population) | 6.1% | 5.6% |
Similar Demographics by Single Mother Households
Demographics Similar to French by Single Mother Households
In terms of single mother households, the demographic groups most similar to French are Syrian (6.0%, a difference of 0.070%), Tsimshian (6.0%, a difference of 0.10%), Immigrants from Egypt (6.0%, a difference of 0.15%), Immigrants from Iraq (6.0%, a difference of 0.19%), and Korean (6.0%, a difference of 0.29%).
| Demographics | Rating | Rank | Single Mother Households |
| Egyptians | 90.7 /100 | #133 | Exceptional 5.9% |
| Canadians | 90.5 /100 | #134 | Exceptional 5.9% |
| Immigrants | Saudi Arabia | 90.2 /100 | #135 | Exceptional 5.9% |
| Jordanians | 88.9 /100 | #136 | Excellent 6.0% |
| Immigrants | Pakistan | 88.4 /100 | #137 | Excellent 6.0% |
| Icelanders | 86.9 /100 | #138 | Excellent 6.0% |
| Syrians | 86.0 /100 | #139 | Excellent 6.0% |
| French | 85.7 /100 | #140 | Excellent 6.0% |
| Tsimshian | 85.2 /100 | #141 | Excellent 6.0% |
| Immigrants | Egypt | 85.0 /100 | #142 | Excellent 6.0% |
| Immigrants | Iraq | 84.8 /100 | #143 | Excellent 6.0% |
| Koreans | 84.4 /100 | #144 | Excellent 6.0% |
| Arabs | 84.0 /100 | #145 | Excellent 6.0% |
| French Canadians | 82.6 /100 | #146 | Excellent 6.0% |
| Immigrants | Jordan | 82.3 /100 | #147 | Excellent 6.0% |
Demographics Similar to Lumbee by Single Mother Households
In terms of single mother households, the demographic groups most similar to Lumbee are Tohono O'odham (9.1%, a difference of 0.36%), Menominee (9.2%, a difference of 0.68%), Dominican (9.2%, a difference of 0.89%), Black/African American (9.0%, a difference of 1.2%), and Cape Verdean (8.9%, a difference of 2.8%).
| Demographics | Rating | Rank | Single Mother Households |
| Liberians | 0.0 /100 | #333 | Tragic 8.6% |
| Immigrants | Liberia | 0.0 /100 | #334 | Tragic 8.7% |
| Immigrants | Dominica | 0.0 /100 | #335 | Tragic 8.7% |
| Puerto Ricans | 0.0 /100 | #336 | Tragic 8.7% |
| Navajo | 0.0 /100 | #337 | Tragic 8.8% |
| Cape Verdeans | 0.0 /100 | #338 | Tragic 8.9% |
| Blacks/African Americans | 0.0 /100 | #339 | Tragic 9.0% |
| Lumbee | 0.0 /100 | #340 | Tragic 9.1% |
| Tohono O'odham | 0.0 /100 | #341 | Tragic 9.1% |
| Menominee | 0.0 /100 | #342 | Tragic 9.2% |
| Dominicans | 0.0 /100 | #343 | Tragic 9.2% |
| Immigrants | Dominican Republic | 0.0 /100 | #344 | Tragic 9.5% |
| Immigrants | Cabo Verde | 0.0 /100 | #345 | Tragic 9.6% |
| Yuman | 0.0 /100 | #346 | Tragic 9.6% |
| Yup'ik | 0.0 /100 | #347 | Tragic 10.0% |