Immigrants from Venezuela vs Lumbee College, Under 1 year
COMPARE
Immigrants from Venezuela
Lumbee
College, Under 1 year
College, Under 1 year Comparison
Immigrants from Venezuela
Lumbee
66.3%
COLLEGE, UNDER 1 YEAR
77.9/ 100
METRIC RATING
149th/ 347
METRIC RANK
54.2%
COLLEGE, UNDER 1 YEAR
0.0/ 100
METRIC RATING
338th/ 347
METRIC RANK
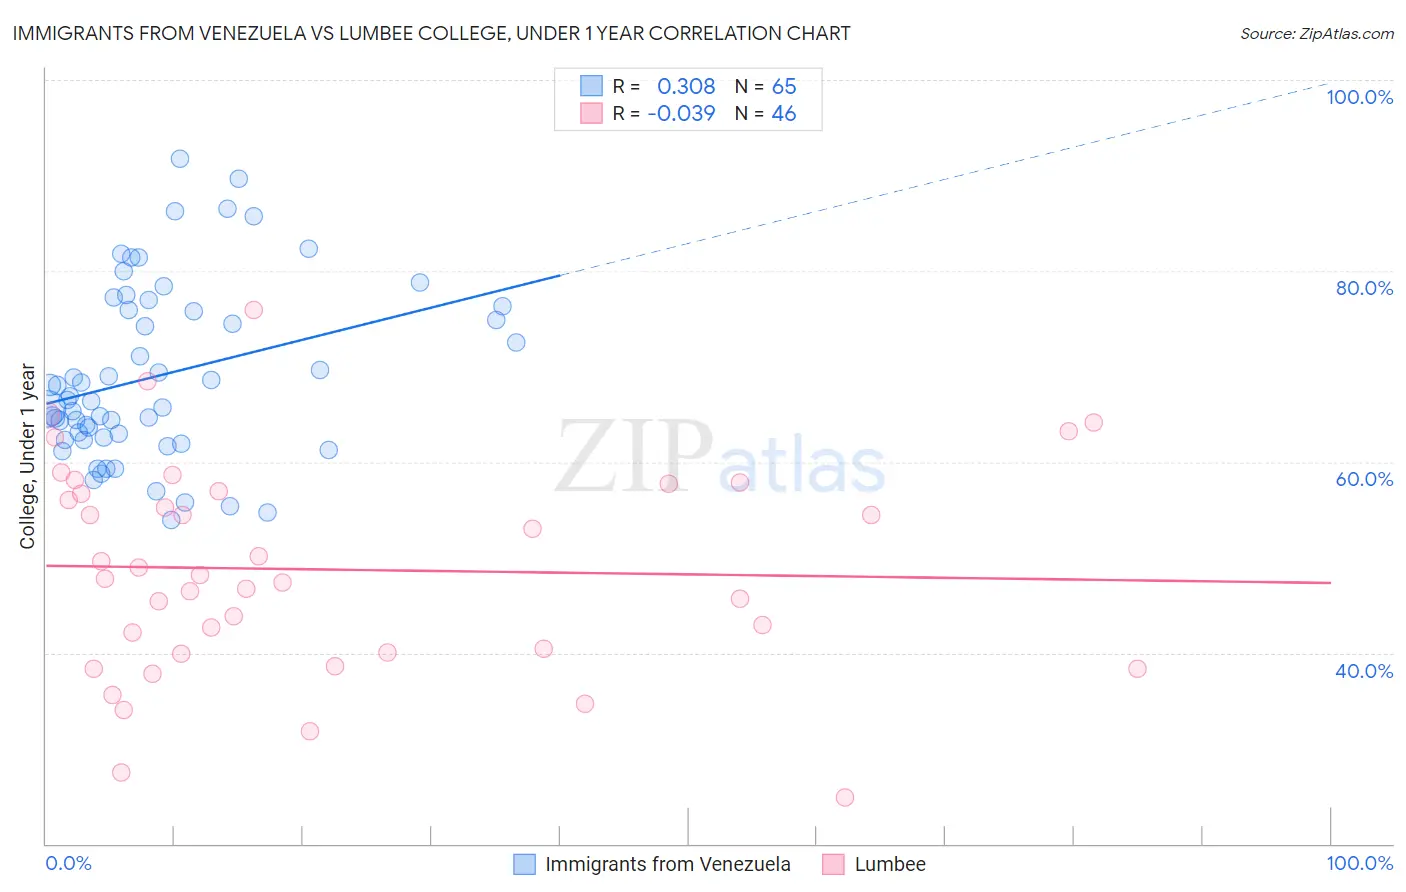
Immigrants from Venezuela vs Lumbee College, Under 1 year Correlation Chart
The statistical analysis conducted on geographies consisting of 287,866,009 people shows a mild positive correlation between the proportion of Immigrants from Venezuela and percentage of population with at least college, under 1 year education in the United States with a correlation coefficient (R) of 0.308 and weighted average of 66.3%. Similarly, the statistical analysis conducted on geographies consisting of 92,299,068 people shows no correlation between the proportion of Lumbee and percentage of population with at least college, under 1 year education in the United States with a correlation coefficient (R) of -0.039 and weighted average of 54.2%, a difference of 22.3%.
College, Under 1 year Correlation Summary
| Measurement | Immigrants from Venezuela | Lumbee |
| Minimum | 53.8% | 24.8% |
| Maximum | 91.7% | 75.9% |
| Range | 37.9% | 51.1% |
| Mean | 69.0% | 48.7% |
| Median | 66.5% | 47.9% |
| Interquartile 25% (IQ1) | 62.4% | 40.0% |
| Interquartile 75% (IQ3) | 76.1% | 56.9% |
| Interquartile Range (IQR) | 13.7% | 16.9% |
| Standard Deviation (Sample) | 9.2% | 11.1% |
| Standard Deviation (Population) | 9.1% | 11.0% |
Similar Demographics by College, Under 1 year
Demographics Similar to Immigrants from Venezuela by College, Under 1 year
In terms of college, under 1 year, the demographic groups most similar to Immigrants from Venezuela are Taiwanese (66.4%, a difference of 0.040%), Immigrants from Iraq (66.3%, a difference of 0.050%), Immigrants from Sudan (66.2%, a difference of 0.12%), Sudanese (66.2%, a difference of 0.23%), and Immigrants from Morocco (66.5%, a difference of 0.25%).
| Demographics | Rating | Rank | College, Under 1 year |
| English | 82.9 /100 | #142 | Excellent 66.6% |
| Immigrants | Uganda | 82.8 /100 | #143 | Excellent 66.5% |
| Immigrants | Germany | 82.0 /100 | #144 | Excellent 66.5% |
| Immigrants | Kenya | 81.8 /100 | #145 | Excellent 66.5% |
| Kenyans | 81.7 /100 | #146 | Excellent 66.5% |
| Immigrants | Morocco | 81.7 /100 | #147 | Excellent 66.5% |
| Taiwanese | 78.6 /100 | #148 | Good 66.4% |
| Immigrants | Venezuela | 77.9 /100 | #149 | Good 66.3% |
| Immigrants | Iraq | 77.1 /100 | #150 | Good 66.3% |
| Immigrants | Sudan | 76.0 /100 | #151 | Good 66.2% |
| Sudanese | 74.1 /100 | #152 | Good 66.2% |
| Belgians | 73.7 /100 | #153 | Good 66.2% |
| Immigrants | Eritrea | 71.9 /100 | #154 | Good 66.1% |
| Irish | 70.3 /100 | #155 | Good 66.0% |
| Welsh | 69.9 /100 | #156 | Good 66.0% |
Demographics Similar to Lumbee by College, Under 1 year
In terms of college, under 1 year, the demographic groups most similar to Lumbee are Immigrants from Dominican Republic (54.0%, a difference of 0.40%), Immigrants from Central America (54.4%, a difference of 0.41%), Spanish American Indian (54.0%, a difference of 0.49%), Pennsylvania German (54.5%, a difference of 0.56%), and Inupiat (54.6%, a difference of 0.73%).
| Demographics | Rating | Rank | College, Under 1 year |
| Dominicans | 0.0 /100 | #331 | Tragic 55.5% |
| Immigrants | Yemen | 0.0 /100 | #332 | Tragic 55.3% |
| Yuman | 0.0 /100 | #333 | Tragic 55.1% |
| Immigrants | Azores | 0.0 /100 | #334 | Tragic 54.7% |
| Inupiat | 0.0 /100 | #335 | Tragic 54.6% |
| Pennsylvania Germans | 0.0 /100 | #336 | Tragic 54.5% |
| Immigrants | Central America | 0.0 /100 | #337 | Tragic 54.4% |
| Lumbee | 0.0 /100 | #338 | Tragic 54.2% |
| Immigrants | Dominican Republic | 0.0 /100 | #339 | Tragic 54.0% |
| Spanish American Indians | 0.0 /100 | #340 | Tragic 54.0% |
| Immigrants | Cabo Verde | 0.0 /100 | #341 | Tragic 53.7% |
| Immigrants | Mexico | 0.0 /100 | #342 | Tragic 53.7% |
| Tohono O'odham | 0.0 /100 | #343 | Tragic 52.8% |
| Yakama | 0.0 /100 | #344 | Tragic 52.6% |
| Pima | 0.0 /100 | #345 | Tragic 51.4% |