Spanish American vs Lumbee College, Under 1 year
COMPARE
Spanish American
Lumbee
College, Under 1 year
College, Under 1 year Comparison
Spanish Americans
Lumbee
62.6%
COLLEGE, UNDER 1 YEAR
1.9/ 100
METRIC RATING
235th/ 347
METRIC RANK
54.2%
COLLEGE, UNDER 1 YEAR
0.0/ 100
METRIC RATING
338th/ 347
METRIC RANK
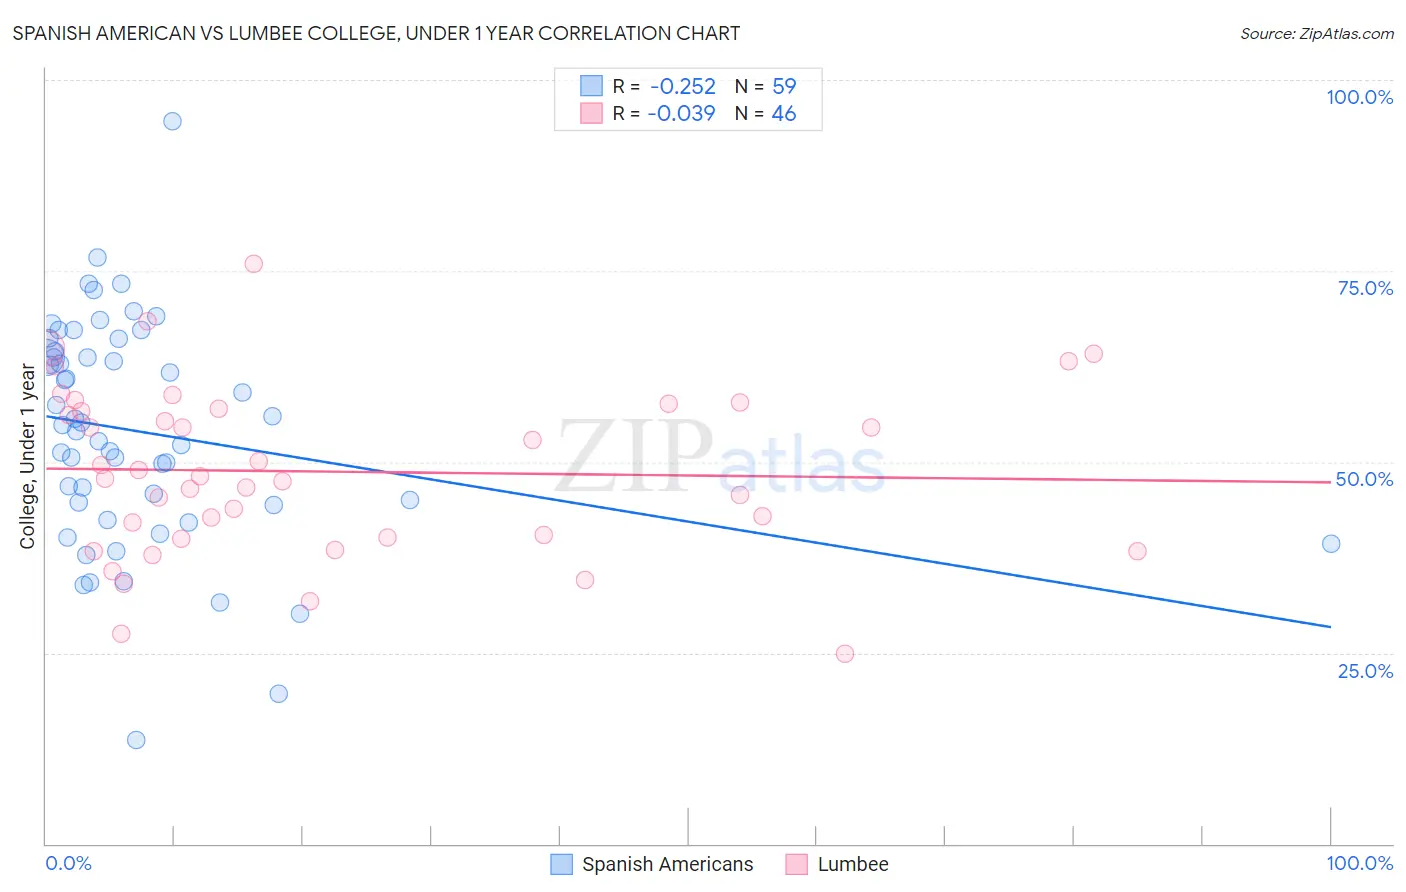
Spanish American vs Lumbee College, Under 1 year Correlation Chart
The statistical analysis conducted on geographies consisting of 103,168,410 people shows a weak negative correlation between the proportion of Spanish Americans and percentage of population with at least college, under 1 year education in the United States with a correlation coefficient (R) of -0.252 and weighted average of 62.6%. Similarly, the statistical analysis conducted on geographies consisting of 92,299,068 people shows no correlation between the proportion of Lumbee and percentage of population with at least college, under 1 year education in the United States with a correlation coefficient (R) of -0.039 and weighted average of 54.2%, a difference of 15.4%.
College, Under 1 year Correlation Summary
| Measurement | Spanish American | Lumbee |
| Minimum | 13.6% | 24.8% |
| Maximum | 94.7% | 75.9% |
| Range | 81.0% | 51.1% |
| Mean | 53.9% | 48.7% |
| Median | 54.9% | 47.9% |
| Interquartile 25% (IQ1) | 44.3% | 40.0% |
| Interquartile 75% (IQ3) | 64.5% | 56.9% |
| Interquartile Range (IQR) | 20.2% | 16.9% |
| Standard Deviation (Sample) | 14.8% | 11.1% |
| Standard Deviation (Population) | 14.7% | 11.0% |
Similar Demographics by College, Under 1 year
Demographics Similar to Spanish Americans by College, Under 1 year
In terms of college, under 1 year, the demographic groups most similar to Spanish Americans are Chippewa (62.6%, a difference of 0.050%), Iroquois (62.6%, a difference of 0.080%), Immigrants (62.5%, a difference of 0.13%), Immigrants from Burma/Myanmar (62.5%, a difference of 0.16%), and Osage (62.7%, a difference of 0.20%).
| Demographics | Rating | Rank | College, Under 1 year |
| Samoans | 3.3 /100 | #228 | Tragic 63.0% |
| Liberians | 3.2 /100 | #229 | Tragic 63.0% |
| Immigrants | Nonimmigrants | 3.0 /100 | #230 | Tragic 62.9% |
| Immigrants | Western Africa | 2.4 /100 | #231 | Tragic 62.8% |
| Osage | 2.2 /100 | #232 | Tragic 62.7% |
| Iroquois | 2.0 /100 | #233 | Tragic 62.6% |
| Chippewa | 2.0 /100 | #234 | Tragic 62.6% |
| Spanish Americans | 1.9 /100 | #235 | Tragic 62.6% |
| Immigrants | Immigrants | 1.7 /100 | #236 | Tragic 62.5% |
| Immigrants | Burma/Myanmar | 1.6 /100 | #237 | Tragic 62.5% |
| French American Indians | 1.5 /100 | #238 | Tragic 62.4% |
| Nepalese | 1.1 /100 | #239 | Tragic 62.2% |
| Aleuts | 1.1 /100 | #240 | Tragic 62.2% |
| Ottawa | 1.1 /100 | #241 | Tragic 62.2% |
| Malaysians | 1.1 /100 | #242 | Tragic 62.2% |
Demographics Similar to Lumbee by College, Under 1 year
In terms of college, under 1 year, the demographic groups most similar to Lumbee are Immigrants from Dominican Republic (54.0%, a difference of 0.40%), Immigrants from Central America (54.4%, a difference of 0.41%), Spanish American Indian (54.0%, a difference of 0.49%), Pennsylvania German (54.5%, a difference of 0.56%), and Inupiat (54.6%, a difference of 0.73%).
| Demographics | Rating | Rank | College, Under 1 year |
| Dominicans | 0.0 /100 | #331 | Tragic 55.5% |
| Immigrants | Yemen | 0.0 /100 | #332 | Tragic 55.3% |
| Yuman | 0.0 /100 | #333 | Tragic 55.1% |
| Immigrants | Azores | 0.0 /100 | #334 | Tragic 54.7% |
| Inupiat | 0.0 /100 | #335 | Tragic 54.6% |
| Pennsylvania Germans | 0.0 /100 | #336 | Tragic 54.5% |
| Immigrants | Central America | 0.0 /100 | #337 | Tragic 54.4% |
| Lumbee | 0.0 /100 | #338 | Tragic 54.2% |
| Immigrants | Dominican Republic | 0.0 /100 | #339 | Tragic 54.0% |
| Spanish American Indians | 0.0 /100 | #340 | Tragic 54.0% |
| Immigrants | Cabo Verde | 0.0 /100 | #341 | Tragic 53.7% |
| Immigrants | Mexico | 0.0 /100 | #342 | Tragic 53.7% |
| Tohono O'odham | 0.0 /100 | #343 | Tragic 52.8% |
| Yakama | 0.0 /100 | #344 | Tragic 52.6% |
| Pima | 0.0 /100 | #345 | Tragic 51.4% |