French vs Immigrants from Liberia College, 1 year or more
COMPARE
French
Immigrants from Liberia
College, 1 year or more
College, 1 year or more Comparison
French
Immigrants from Liberia
58.9%
COLLEGE, 1 YEAR OR MORE
34.4/ 100
METRIC RATING
188th/ 347
METRIC RANK
55.7%
COLLEGE, 1 YEAR OR MORE
0.8/ 100
METRIC RATING
245th/ 347
METRIC RANK
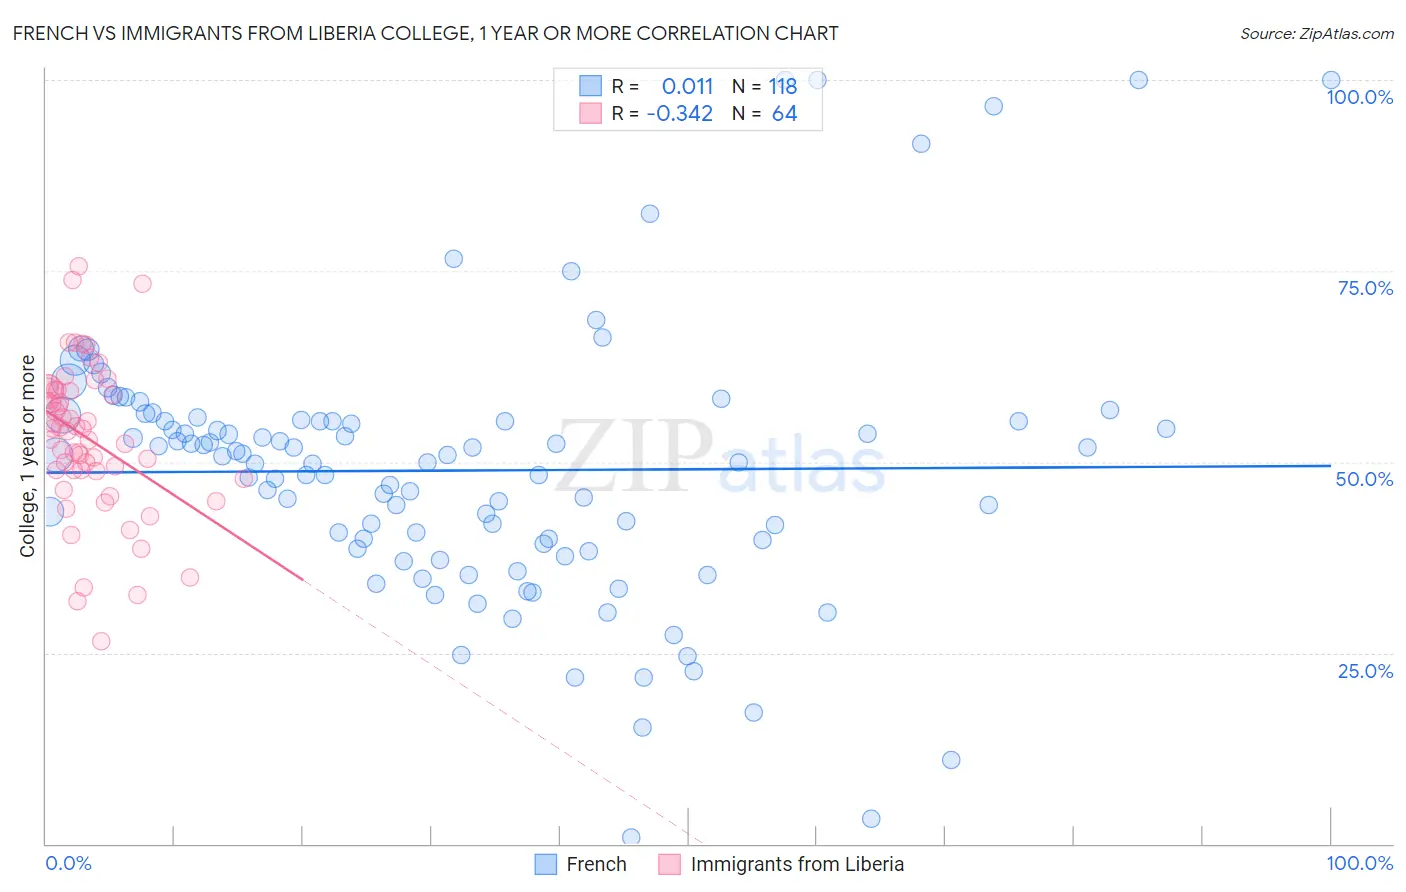
French vs Immigrants from Liberia College, 1 year or more Correlation Chart
The statistical analysis conducted on geographies consisting of 572,417,926 people shows no correlation between the proportion of French and percentage of population with at least college, 1 year or more education in the United States with a correlation coefficient (R) of 0.011 and weighted average of 58.9%. Similarly, the statistical analysis conducted on geographies consisting of 135,295,665 people shows a mild negative correlation between the proportion of Immigrants from Liberia and percentage of population with at least college, 1 year or more education in the United States with a correlation coefficient (R) of -0.342 and weighted average of 55.7%, a difference of 5.8%.
College, 1 year or more Correlation Summary
| Measurement | French | Immigrants from Liberia |
| Minimum | 0.78% | 26.5% |
| Maximum | 100.0% | 75.6% |
| Range | 99.2% | 49.1% |
| Mean | 48.9% | 53.1% |
| Median | 50.4% | 54.2% |
| Interquartile 25% (IQ1) | 39.3% | 48.9% |
| Interquartile 75% (IQ3) | 55.4% | 59.4% |
| Interquartile Range (IQR) | 16.1% | 10.5% |
| Standard Deviation (Sample) | 17.8% | 9.9% |
| Standard Deviation (Population) | 17.7% | 9.8% |
Similar Demographics by College, 1 year or more
Demographics Similar to French by College, 1 year or more
In terms of college, 1 year or more, the demographic groups most similar to French are Scotch-Irish (58.9%, a difference of 0.020%), German (58.9%, a difference of 0.020%), South American (59.0%, a difference of 0.090%), Uruguayan (58.8%, a difference of 0.15%), and Immigrants from Cameroon (58.8%, a difference of 0.19%).
| Demographics | Rating | Rank | College, 1 year or more |
| Swiss | 43.4 /100 | #181 | Average 59.2% |
| Immigrants | Bosnia and Herzegovina | 42.8 /100 | #182 | Average 59.2% |
| German Russians | 39.3 /100 | #183 | Fair 59.1% |
| Spaniards | 38.3 /100 | #184 | Fair 59.0% |
| South Americans | 35.9 /100 | #185 | Fair 59.0% |
| Scotch-Irish | 34.7 /100 | #186 | Fair 58.9% |
| Germans | 34.7 /100 | #187 | Fair 58.9% |
| French | 34.4 /100 | #188 | Fair 58.9% |
| Uruguayans | 31.8 /100 | #189 | Fair 58.8% |
| Immigrants | Cameroon | 31.2 /100 | #190 | Fair 58.8% |
| Immigrants | Philippines | 29.2 /100 | #191 | Fair 58.7% |
| Colombians | 27.6 /100 | #192 | Fair 58.7% |
| Peruvians | 27.5 /100 | #193 | Fair 58.6% |
| Costa Ricans | 26.4 /100 | #194 | Fair 58.6% |
| Dutch | 26.2 /100 | #195 | Fair 58.6% |
Demographics Similar to Immigrants from Liberia by College, 1 year or more
In terms of college, 1 year or more, the demographic groups most similar to Immigrants from Liberia are Malaysian (55.6%, a difference of 0.050%), Chippewa (55.7%, a difference of 0.070%), Hawaiian (55.6%, a difference of 0.12%), Immigrants from Congo (55.6%, a difference of 0.16%), and Osage (55.8%, a difference of 0.19%).
| Demographics | Rating | Rank | College, 1 year or more |
| Barbadians | 1.3 /100 | #238 | Tragic 56.0% |
| Puget Sound Salish | 1.1 /100 | #239 | Tragic 55.9% |
| Trinidadians and Tobagonians | 1.1 /100 | #240 | Tragic 55.8% |
| French American Indians | 1.0 /100 | #241 | Tragic 55.8% |
| Marshallese | 1.0 /100 | #242 | Tragic 55.8% |
| Osage | 1.0 /100 | #243 | Tragic 55.8% |
| Chippewa | 0.9 /100 | #244 | Tragic 55.7% |
| Immigrants | Liberia | 0.8 /100 | #245 | Tragic 55.7% |
| Malaysians | 0.8 /100 | #246 | Tragic 55.6% |
| Hawaiians | 0.8 /100 | #247 | Tragic 55.6% |
| Immigrants | Congo | 0.8 /100 | #248 | Tragic 55.6% |
| Immigrants | Trinidad and Tobago | 0.7 /100 | #249 | Tragic 55.5% |
| Delaware | 0.7 /100 | #250 | Tragic 55.5% |
| Immigrants | Cambodia | 0.6 /100 | #251 | Tragic 55.4% |
| Aleuts | 0.6 /100 | #252 | Tragic 55.4% |