French vs Immigrants from Latin America College, 1 year or more
COMPARE
French
Immigrants from Latin America
College, 1 year or more
College, 1 year or more Comparison
French
Immigrants from Latin America
58.9%
COLLEGE, 1 YEAR OR MORE
34.4/ 100
METRIC RATING
188th/ 347
METRIC RANK
50.7%
COLLEGE, 1 YEAR OR MORE
0.0/ 100
METRIC RATING
325th/ 347
METRIC RANK
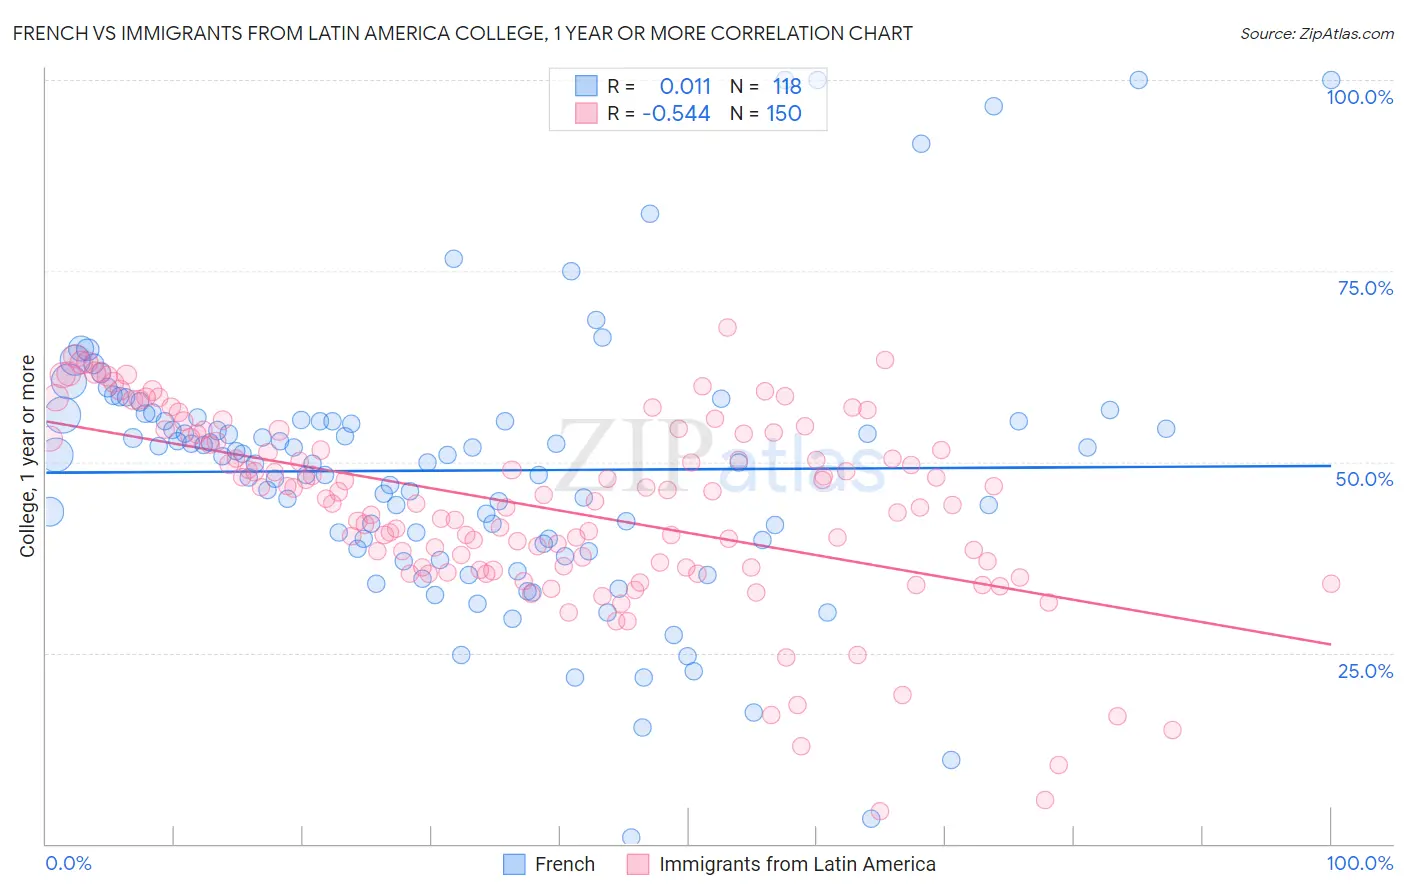
French vs Immigrants from Latin America College, 1 year or more Correlation Chart
The statistical analysis conducted on geographies consisting of 572,417,926 people shows no correlation between the proportion of French and percentage of population with at least college, 1 year or more education in the United States with a correlation coefficient (R) of 0.011 and weighted average of 58.9%. Similarly, the statistical analysis conducted on geographies consisting of 558,635,487 people shows a substantial negative correlation between the proportion of Immigrants from Latin America and percentage of population with at least college, 1 year or more education in the United States with a correlation coefficient (R) of -0.544 and weighted average of 50.7%, a difference of 16.2%.
College, 1 year or more Correlation Summary
| Measurement | French | Immigrants from Latin America |
| Minimum | 0.78% | 4.2% |
| Maximum | 100.0% | 67.7% |
| Range | 99.2% | 63.5% |
| Mean | 48.9% | 44.2% |
| Median | 50.4% | 45.4% |
| Interquartile 25% (IQ1) | 39.3% | 36.2% |
| Interquartile 75% (IQ3) | 55.4% | 53.6% |
| Interquartile Range (IQR) | 16.1% | 17.4% |
| Standard Deviation (Sample) | 17.8% | 12.3% |
| Standard Deviation (Population) | 17.7% | 12.2% |
Similar Demographics by College, 1 year or more
Demographics Similar to French by College, 1 year or more
In terms of college, 1 year or more, the demographic groups most similar to French are Scotch-Irish (58.9%, a difference of 0.020%), German (58.9%, a difference of 0.020%), South American (59.0%, a difference of 0.090%), Uruguayan (58.8%, a difference of 0.15%), and Immigrants from Cameroon (58.8%, a difference of 0.19%).
| Demographics | Rating | Rank | College, 1 year or more |
| Swiss | 43.4 /100 | #181 | Average 59.2% |
| Immigrants | Bosnia and Herzegovina | 42.8 /100 | #182 | Average 59.2% |
| German Russians | 39.3 /100 | #183 | Fair 59.1% |
| Spaniards | 38.3 /100 | #184 | Fair 59.0% |
| South Americans | 35.9 /100 | #185 | Fair 59.0% |
| Scotch-Irish | 34.7 /100 | #186 | Fair 58.9% |
| Germans | 34.7 /100 | #187 | Fair 58.9% |
| French | 34.4 /100 | #188 | Fair 58.9% |
| Uruguayans | 31.8 /100 | #189 | Fair 58.8% |
| Immigrants | Cameroon | 31.2 /100 | #190 | Fair 58.8% |
| Immigrants | Philippines | 29.2 /100 | #191 | Fair 58.7% |
| Colombians | 27.6 /100 | #192 | Fair 58.7% |
| Peruvians | 27.5 /100 | #193 | Fair 58.6% |
| Costa Ricans | 26.4 /100 | #194 | Fair 58.6% |
| Dutch | 26.2 /100 | #195 | Fair 58.6% |
Demographics Similar to Immigrants from Latin America by College, 1 year or more
In terms of college, 1 year or more, the demographic groups most similar to Immigrants from Latin America are Immigrants from Cuba (50.7%, a difference of 0.030%), Immigrants from Guatemala (50.7%, a difference of 0.040%), Dominican (50.6%, a difference of 0.18%), Menominee (50.6%, a difference of 0.22%), and Navajo (50.8%, a difference of 0.27%).
| Demographics | Rating | Rank | College, 1 year or more |
| Immigrants | Honduras | 0.0 /100 | #318 | Tragic 51.0% |
| Immigrants | El Salvador | 0.0 /100 | #319 | Tragic 51.0% |
| Kiowa | 0.0 /100 | #320 | Tragic 51.0% |
| Hopi | 0.0 /100 | #321 | Tragic 50.9% |
| Navajo | 0.0 /100 | #322 | Tragic 50.8% |
| Immigrants | Guatemala | 0.0 /100 | #323 | Tragic 50.7% |
| Immigrants | Cuba | 0.0 /100 | #324 | Tragic 50.7% |
| Immigrants | Latin America | 0.0 /100 | #325 | Tragic 50.7% |
| Dominicans | 0.0 /100 | #326 | Tragic 50.6% |
| Menominee | 0.0 /100 | #327 | Tragic 50.6% |
| Dutch West Indians | 0.0 /100 | #328 | Tragic 50.5% |
| Cape Verdeans | 0.0 /100 | #329 | Tragic 50.3% |
| Natives/Alaskans | 0.0 /100 | #330 | Tragic 50.2% |
| Immigrants | Yemen | 0.0 /100 | #331 | Tragic 50.0% |
| Mexicans | 0.0 /100 | #332 | Tragic 49.2% |