Ethiopian vs New Zealander No Schooling Completed
COMPARE
Ethiopian
New Zealander
No Schooling Completed
No Schooling Completed Comparison
Ethiopians
New Zealanders
2.4%
NO SCHOOLING COMPLETED
0.8/ 100
METRIC RATING
255th/ 347
METRIC RANK
1.7%
NO SCHOOLING COMPLETED
99.7/ 100
METRIC RATING
64th/ 347
METRIC RANK
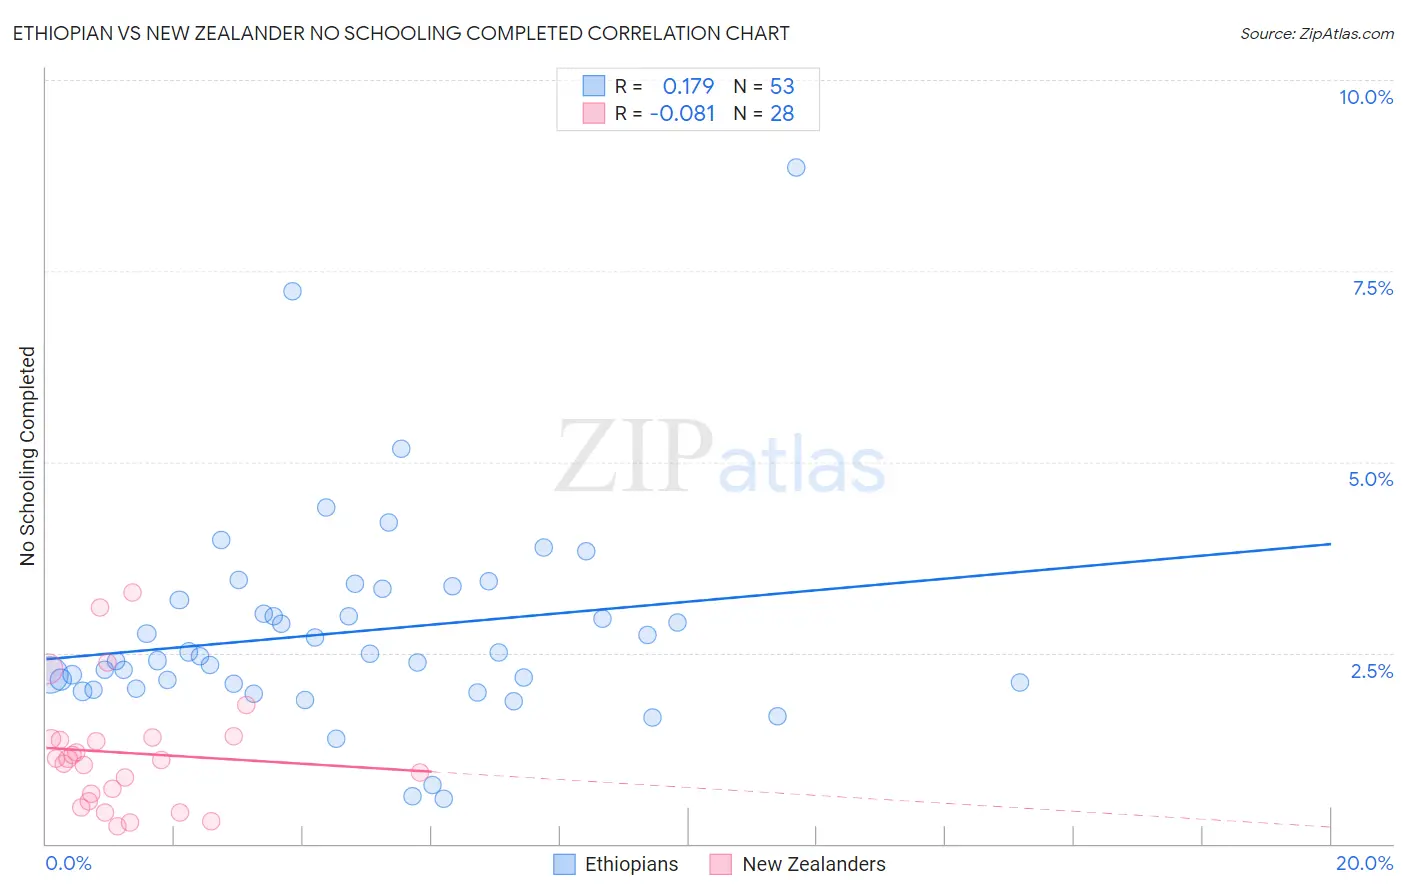
Ethiopian vs New Zealander No Schooling Completed Correlation Chart
The statistical analysis conducted on geographies consisting of 222,131,269 people shows a poor positive correlation between the proportion of Ethiopians and percentage of population with no schooling in the United States with a correlation coefficient (R) of 0.179 and weighted average of 2.4%. Similarly, the statistical analysis conducted on geographies consisting of 106,449,248 people shows a slight negative correlation between the proportion of New Zealanders and percentage of population with no schooling in the United States with a correlation coefficient (R) of -0.081 and weighted average of 1.7%, a difference of 45.2%.
No Schooling Completed Correlation Summary
| Measurement | Ethiopian | New Zealander |
| Minimum | 0.59% | 0.23% |
| Maximum | 8.8% | 3.3% |
| Range | 8.3% | 3.1% |
| Mean | 2.8% | 1.2% |
| Median | 2.4% | 1.1% |
| Interquartile 25% (IQ1) | 2.1% | 0.60% |
| Interquartile 75% (IQ3) | 3.3% | 1.4% |
| Interquartile Range (IQR) | 1.2% | 0.78% |
| Standard Deviation (Sample) | 1.4% | 0.78% |
| Standard Deviation (Population) | 1.4% | 0.77% |
Similar Demographics by No Schooling Completed
Demographics Similar to Ethiopians by No Schooling Completed
In terms of no schooling completed, the demographic groups most similar to Ethiopians are Yaqui (2.4%, a difference of 0.17%), Immigrants from Eastern Africa (2.4%, a difference of 0.20%), Immigrants from Asia (2.4%, a difference of 0.33%), Immigrants from Colombia (2.4%, a difference of 0.45%), and Immigrants from Africa (2.4%, a difference of 0.90%).
| Demographics | Rating | Rank | No Schooling Completed |
| Asians | 1.2 /100 | #248 | Tragic 2.4% |
| Jamaicans | 1.2 /100 | #249 | Tragic 2.4% |
| Immigrants | Middle Africa | 1.1 /100 | #250 | Tragic 2.4% |
| Immigrants | Africa | 1.1 /100 | #251 | Tragic 2.4% |
| Immigrants | Colombia | 1.0 /100 | #252 | Tragic 2.4% |
| Immigrants | Asia | 0.9 /100 | #253 | Tragic 2.4% |
| Immigrants | Eastern Africa | 0.9 /100 | #254 | Tragic 2.4% |
| Ethiopians | 0.8 /100 | #255 | Tragic 2.4% |
| Yaqui | 0.8 /100 | #256 | Tragic 2.4% |
| Immigrants | South America | 0.6 /100 | #257 | Tragic 2.5% |
| Assyrians/Chaldeans/Syriacs | 0.6 /100 | #258 | Tragic 2.5% |
| Immigrants | Jamaica | 0.6 /100 | #259 | Tragic 2.5% |
| Immigrants | Ethiopia | 0.6 /100 | #260 | Tragic 2.5% |
| Armenians | 0.5 /100 | #261 | Tragic 2.5% |
| Immigrants | Sierra Leone | 0.5 /100 | #262 | Tragic 2.5% |
Demographics Similar to New Zealanders by No Schooling Completed
In terms of no schooling completed, the demographic groups most similar to New Zealanders are Serbian (1.7%, a difference of 0.040%), Russian (1.7%, a difference of 0.16%), Canadian (1.7%, a difference of 0.18%), Immigrants from Northern Europe (1.7%, a difference of 0.20%), and Immigrants from Austria (1.7%, a difference of 0.37%).
| Demographics | Rating | Rank | No Schooling Completed |
| Austrians | 99.8 /100 | #57 | Exceptional 1.6% |
| Kiowa | 99.8 /100 | #58 | Exceptional 1.6% |
| Slavs | 99.8 /100 | #59 | Exceptional 1.7% |
| Americans | 99.8 /100 | #60 | Exceptional 1.7% |
| Tsimshian | 99.8 /100 | #61 | Exceptional 1.7% |
| Immigrants | Northern Europe | 99.8 /100 | #62 | Exceptional 1.7% |
| Russians | 99.8 /100 | #63 | Exceptional 1.7% |
| New Zealanders | 99.7 /100 | #64 | Exceptional 1.7% |
| Serbians | 99.7 /100 | #65 | Exceptional 1.7% |
| Canadians | 99.7 /100 | #66 | Exceptional 1.7% |
| Immigrants | Austria | 99.7 /100 | #67 | Exceptional 1.7% |
| Immigrants | Lithuania | 99.7 /100 | #68 | Exceptional 1.7% |
| Chickasaw | 99.6 /100 | #69 | Exceptional 1.7% |
| Immigrants | Netherlands | 99.6 /100 | #70 | Exceptional 1.7% |
| Immigrants | England | 99.5 /100 | #71 | Exceptional 1.7% |