Ethiopian vs Immigrants from Indonesia No Schooling Completed
COMPARE
Ethiopian
Immigrants from Indonesia
No Schooling Completed
No Schooling Completed Comparison
Ethiopians
Immigrants from Indonesia
2.4%
NO SCHOOLING COMPLETED
0.8/ 100
METRIC RATING
255th/ 347
METRIC RANK
2.4%
NO SCHOOLING COMPLETED
1.5/ 100
METRIC RATING
242nd/ 347
METRIC RANK
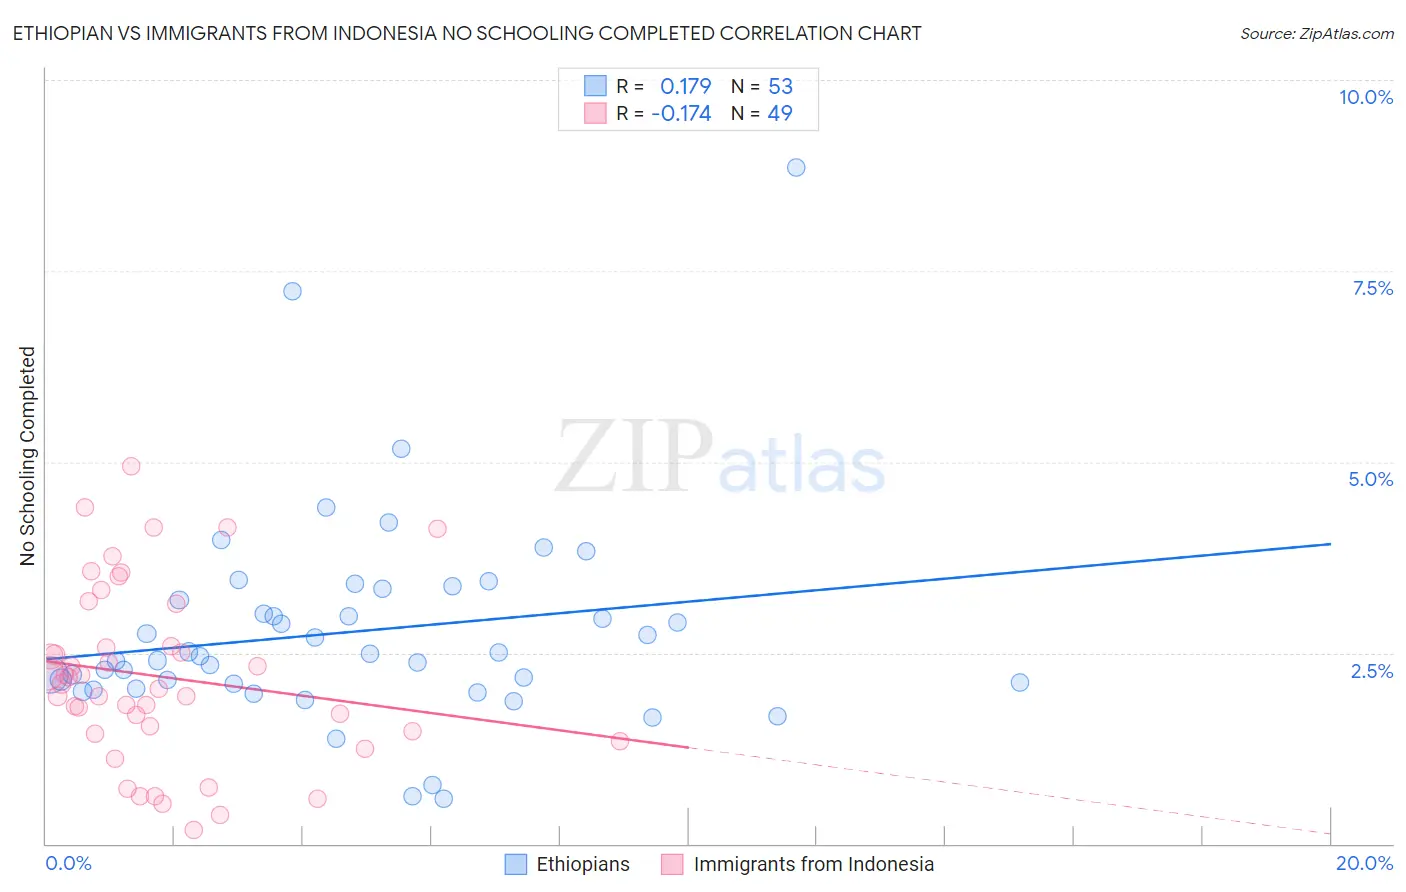
Ethiopian vs Immigrants from Indonesia No Schooling Completed Correlation Chart
The statistical analysis conducted on geographies consisting of 222,131,269 people shows a poor positive correlation between the proportion of Ethiopians and percentage of population with no schooling in the United States with a correlation coefficient (R) of 0.179 and weighted average of 2.4%. Similarly, the statistical analysis conducted on geographies consisting of 214,703,374 people shows a poor negative correlation between the proportion of Immigrants from Indonesia and percentage of population with no schooling in the United States with a correlation coefficient (R) of -0.174 and weighted average of 2.4%, a difference of 1.7%.
No Schooling Completed Correlation Summary
| Measurement | Ethiopian | Immigrants from Indonesia |
| Minimum | 0.59% | 0.18% |
| Maximum | 8.8% | 4.9% |
| Range | 8.3% | 4.8% |
| Mean | 2.8% | 2.2% |
| Median | 2.4% | 2.1% |
| Interquartile 25% (IQ1) | 2.1% | 1.5% |
| Interquartile 75% (IQ3) | 3.3% | 2.9% |
| Interquartile Range (IQR) | 1.2% | 1.4% |
| Standard Deviation (Sample) | 1.4% | 1.1% |
| Standard Deviation (Population) | 1.4% | 1.1% |
Demographics Similar to Ethiopians and Immigrants from Indonesia by No Schooling Completed
In terms of no schooling completed, the demographic groups most similar to Ethiopians are Yaqui (2.4%, a difference of 0.17%), Immigrants from Eastern Africa (2.4%, a difference of 0.20%), Immigrants from Asia (2.4%, a difference of 0.33%), Immigrants from Colombia (2.4%, a difference of 0.45%), and Immigrants from Africa (2.4%, a difference of 0.90%). Similarly, the demographic groups most similar to Immigrants from Indonesia are South American (2.4%, a difference of 0.040%), Peruvian (2.4%, a difference of 0.14%), Bolivian (2.4%, a difference of 0.15%), Immigrants from Congo (2.4%, a difference of 0.20%), and Immigrants from Iraq (2.4%, a difference of 0.30%).
| Demographics | Rating | Rank | No Schooling Completed |
| Paiute | 1.9 /100 | #238 | Tragic 2.4% |
| Liberians | 1.8 /100 | #239 | Tragic 2.4% |
| Immigrants | Senegal | 1.7 /100 | #240 | Tragic 2.4% |
| Koreans | 1.7 /100 | #241 | Tragic 2.4% |
| Immigrants | Indonesia | 1.5 /100 | #242 | Tragic 2.4% |
| South Americans | 1.5 /100 | #243 | Tragic 2.4% |
| Peruvians | 1.4 /100 | #244 | Tragic 2.4% |
| Bolivians | 1.4 /100 | #245 | Tragic 2.4% |
| Immigrants | Congo | 1.4 /100 | #246 | Tragic 2.4% |
| Immigrants | Iraq | 1.3 /100 | #247 | Tragic 2.4% |
| Asians | 1.2 /100 | #248 | Tragic 2.4% |
| Jamaicans | 1.2 /100 | #249 | Tragic 2.4% |
| Immigrants | Middle Africa | 1.1 /100 | #250 | Tragic 2.4% |
| Immigrants | Africa | 1.1 /100 | #251 | Tragic 2.4% |
| Immigrants | Colombia | 1.0 /100 | #252 | Tragic 2.4% |
| Immigrants | Asia | 0.9 /100 | #253 | Tragic 2.4% |
| Immigrants | Eastern Africa | 0.9 /100 | #254 | Tragic 2.4% |
| Ethiopians | 0.8 /100 | #255 | Tragic 2.4% |
| Yaqui | 0.8 /100 | #256 | Tragic 2.4% |
| Immigrants | South America | 0.6 /100 | #257 | Tragic 2.5% |
| Assyrians/Chaldeans/Syriacs | 0.6 /100 | #258 | Tragic 2.5% |