Immigrants from South Eastern Asia vs New Zealander No Schooling Completed
COMPARE
Immigrants from South Eastern Asia
New Zealander
No Schooling Completed
No Schooling Completed Comparison
Immigrants from South Eastern Asia
New Zealanders
2.9%
NO SCHOOLING COMPLETED
0.0/ 100
METRIC RATING
301st/ 347
METRIC RANK
1.7%
NO SCHOOLING COMPLETED
99.7/ 100
METRIC RATING
64th/ 347
METRIC RANK
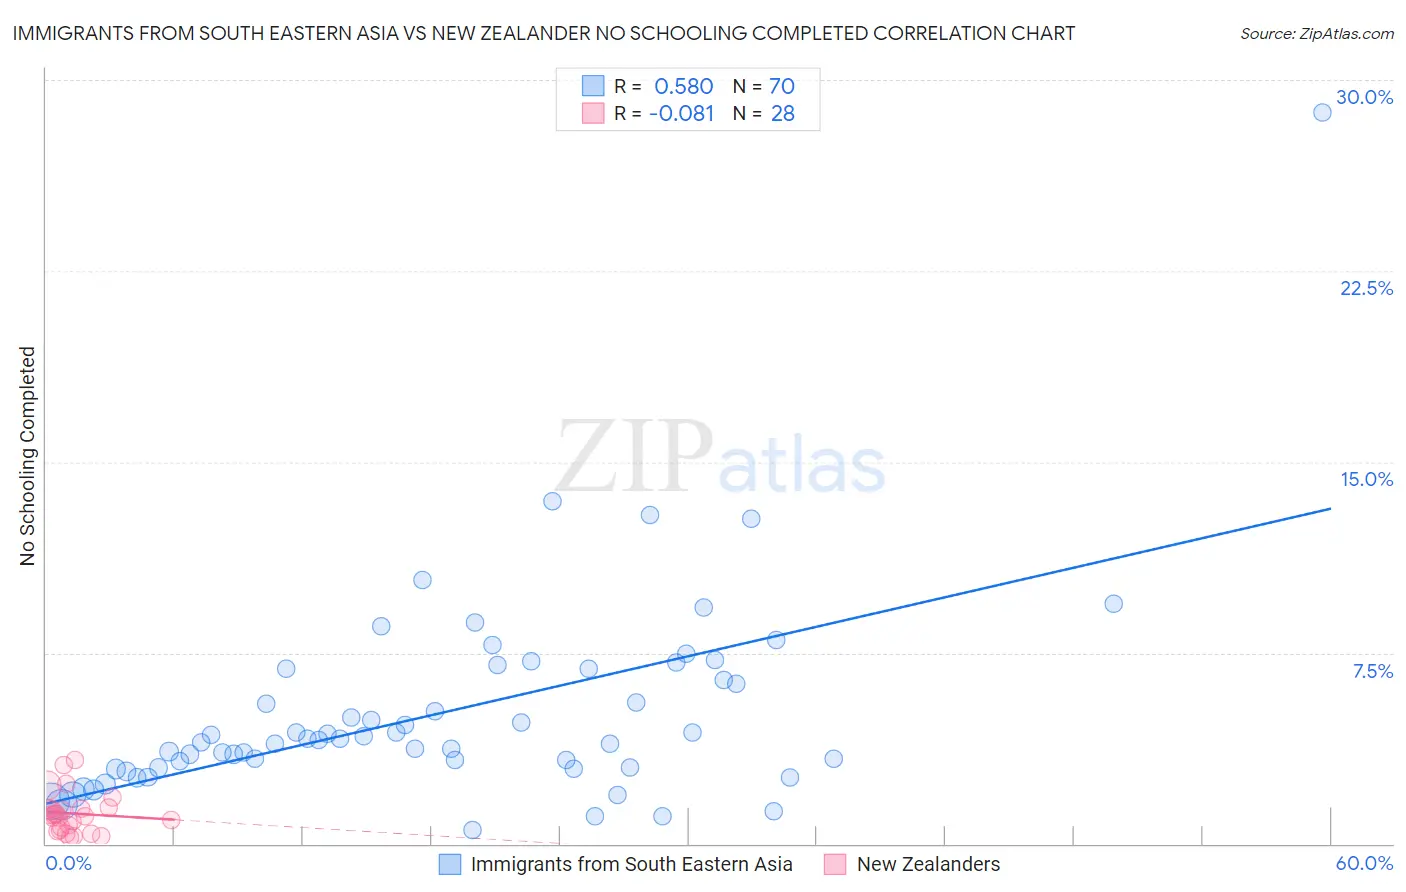
Immigrants from South Eastern Asia vs New Zealander No Schooling Completed Correlation Chart
The statistical analysis conducted on geographies consisting of 503,951,834 people shows a substantial positive correlation between the proportion of Immigrants from South Eastern Asia and percentage of population with no schooling in the United States with a correlation coefficient (R) of 0.580 and weighted average of 2.9%. Similarly, the statistical analysis conducted on geographies consisting of 106,449,248 people shows a slight negative correlation between the proportion of New Zealanders and percentage of population with no schooling in the United States with a correlation coefficient (R) of -0.081 and weighted average of 1.7%, a difference of 73.3%.
No Schooling Completed Correlation Summary
| Measurement | Immigrants from South Eastern Asia | New Zealander |
| Minimum | 0.56% | 0.23% |
| Maximum | 28.7% | 3.3% |
| Range | 28.2% | 3.1% |
| Mean | 5.1% | 1.2% |
| Median | 4.1% | 1.1% |
| Interquartile 25% (IQ1) | 3.0% | 0.60% |
| Interquartile 75% (IQ3) | 6.9% | 1.4% |
| Interquartile Range (IQR) | 3.9% | 0.78% |
| Standard Deviation (Sample) | 4.0% | 0.78% |
| Standard Deviation (Population) | 4.0% | 0.77% |
Similar Demographics by No Schooling Completed
Demographics Similar to Immigrants from South Eastern Asia by No Schooling Completed
In terms of no schooling completed, the demographic groups most similar to Immigrants from South Eastern Asia are Immigrants from Caribbean (2.9%, a difference of 0.37%), Somali (2.9%, a difference of 1.4%), Haitian (2.9%, a difference of 1.5%), Nicaraguan (2.9%, a difference of 1.5%), and Central American Indian (2.8%, a difference of 1.8%).
| Demographics | Rating | Rank | No Schooling Completed |
| Immigrants | Eritrea | 0.0 /100 | #294 | Tragic 2.8% |
| Houma | 0.0 /100 | #295 | Tragic 2.8% |
| Immigrants | Immigrants | 0.0 /100 | #296 | Tragic 2.8% |
| Immigrants | Cuba | 0.0 /100 | #297 | Tragic 2.8% |
| Immigrants | Dominica | 0.0 /100 | #298 | Tragic 2.8% |
| Central American Indians | 0.0 /100 | #299 | Tragic 2.8% |
| Haitians | 0.0 /100 | #300 | Tragic 2.9% |
| Immigrants | South Eastern Asia | 0.0 /100 | #301 | Tragic 2.9% |
| Immigrants | Caribbean | 0.0 /100 | #302 | Tragic 2.9% |
| Somalis | 0.0 /100 | #303 | Tragic 2.9% |
| Nicaraguans | 0.0 /100 | #304 | Tragic 2.9% |
| Ecuadorians | 0.0 /100 | #305 | Tragic 3.0% |
| Belizeans | 0.0 /100 | #306 | Tragic 3.0% |
| Immigrants | Haiti | 0.0 /100 | #307 | Tragic 3.0% |
| Immigrants | Somalia | 0.0 /100 | #308 | Tragic 3.0% |
Demographics Similar to New Zealanders by No Schooling Completed
In terms of no schooling completed, the demographic groups most similar to New Zealanders are Serbian (1.7%, a difference of 0.040%), Russian (1.7%, a difference of 0.16%), Canadian (1.7%, a difference of 0.18%), Immigrants from Northern Europe (1.7%, a difference of 0.20%), and Immigrants from Austria (1.7%, a difference of 0.37%).
| Demographics | Rating | Rank | No Schooling Completed |
| Austrians | 99.8 /100 | #57 | Exceptional 1.6% |
| Kiowa | 99.8 /100 | #58 | Exceptional 1.6% |
| Slavs | 99.8 /100 | #59 | Exceptional 1.7% |
| Americans | 99.8 /100 | #60 | Exceptional 1.7% |
| Tsimshian | 99.8 /100 | #61 | Exceptional 1.7% |
| Immigrants | Northern Europe | 99.8 /100 | #62 | Exceptional 1.7% |
| Russians | 99.8 /100 | #63 | Exceptional 1.7% |
| New Zealanders | 99.7 /100 | #64 | Exceptional 1.7% |
| Serbians | 99.7 /100 | #65 | Exceptional 1.7% |
| Canadians | 99.7 /100 | #66 | Exceptional 1.7% |
| Immigrants | Austria | 99.7 /100 | #67 | Exceptional 1.7% |
| Immigrants | Lithuania | 99.7 /100 | #68 | Exceptional 1.7% |
| Chickasaw | 99.6 /100 | #69 | Exceptional 1.7% |
| Immigrants | Netherlands | 99.6 /100 | #70 | Exceptional 1.7% |
| Immigrants | England | 99.5 /100 | #71 | Exceptional 1.7% |