Bulgarian vs New Zealander No Schooling Completed
COMPARE
Bulgarian
New Zealander
No Schooling Completed
No Schooling Completed Comparison
Bulgarians
New Zealanders
1.6%
NO SCHOOLING COMPLETED
99.9/ 100
METRIC RATING
42nd/ 347
METRIC RANK
1.7%
NO SCHOOLING COMPLETED
99.7/ 100
METRIC RATING
64th/ 347
METRIC RANK
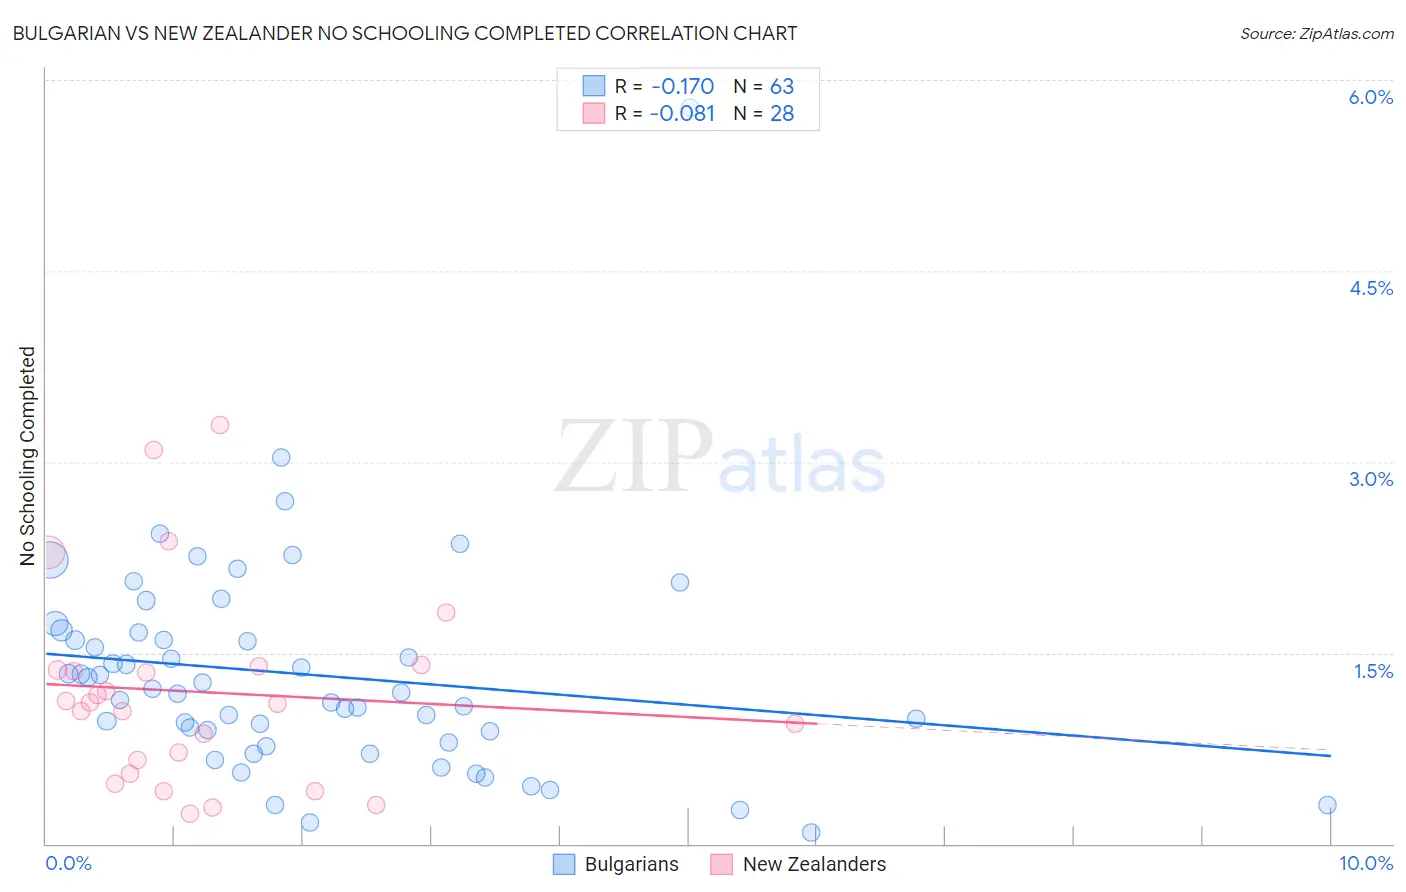
Bulgarian vs New Zealander No Schooling Completed Correlation Chart
The statistical analysis conducted on geographies consisting of 204,511,013 people shows a poor negative correlation between the proportion of Bulgarians and percentage of population with no schooling in the United States with a correlation coefficient (R) of -0.170 and weighted average of 1.6%. Similarly, the statistical analysis conducted on geographies consisting of 106,449,248 people shows a slight negative correlation between the proportion of New Zealanders and percentage of population with no schooling in the United States with a correlation coefficient (R) of -0.081 and weighted average of 1.7%, a difference of 3.4%.
No Schooling Completed Correlation Summary
| Measurement | Bulgarian | New Zealander |
| Minimum | 0.085% | 0.23% |
| Maximum | 5.8% | 3.3% |
| Range | 5.7% | 3.1% |
| Mean | 1.3% | 1.2% |
| Median | 1.2% | 1.1% |
| Interquartile 25% (IQ1) | 0.80% | 0.60% |
| Interquartile 75% (IQ3) | 1.7% | 1.4% |
| Interquartile Range (IQR) | 0.86% | 0.78% |
| Standard Deviation (Sample) | 0.86% | 0.78% |
| Standard Deviation (Population) | 0.86% | 0.77% |
Similar Demographics by No Schooling Completed
Demographics Similar to Bulgarians by No Schooling Completed
In terms of no schooling completed, the demographic groups most similar to Bulgarians are Australian (1.6%, a difference of 0.12%), Estonian (1.6%, a difference of 0.31%), Czechoslovakian (1.6%, a difference of 0.35%), Maltese (1.6%, a difference of 0.44%), and Ottawa (1.6%, a difference of 0.59%).
| Demographics | Rating | Rank | No Schooling Completed |
| Eastern Europeans | 100.0 /100 | #35 | Exceptional 1.6% |
| Aleuts | 99.9 /100 | #36 | Exceptional 1.6% |
| Belgians | 99.9 /100 | #37 | Exceptional 1.6% |
| Northern Europeans | 99.9 /100 | #38 | Exceptional 1.6% |
| Native Hawaiians | 99.9 /100 | #39 | Exceptional 1.6% |
| Luxembourgers | 99.9 /100 | #40 | Exceptional 1.6% |
| Hungarians | 99.9 /100 | #41 | Exceptional 1.6% |
| Bulgarians | 99.9 /100 | #42 | Exceptional 1.6% |
| Australians | 99.9 /100 | #43 | Exceptional 1.6% |
| Estonians | 99.9 /100 | #44 | Exceptional 1.6% |
| Czechoslovakians | 99.9 /100 | #45 | Exceptional 1.6% |
| Maltese | 99.9 /100 | #46 | Exceptional 1.6% |
| Ottawa | 99.9 /100 | #47 | Exceptional 1.6% |
| Immigrants | Scotland | 99.9 /100 | #48 | Exceptional 1.6% |
| Whites/Caucasians | 99.9 /100 | #49 | Exceptional 1.6% |
Demographics Similar to New Zealanders by No Schooling Completed
In terms of no schooling completed, the demographic groups most similar to New Zealanders are Serbian (1.7%, a difference of 0.040%), Russian (1.7%, a difference of 0.16%), Canadian (1.7%, a difference of 0.18%), Immigrants from Northern Europe (1.7%, a difference of 0.20%), and Immigrants from Austria (1.7%, a difference of 0.37%).
| Demographics | Rating | Rank | No Schooling Completed |
| Austrians | 99.8 /100 | #57 | Exceptional 1.6% |
| Kiowa | 99.8 /100 | #58 | Exceptional 1.6% |
| Slavs | 99.8 /100 | #59 | Exceptional 1.7% |
| Americans | 99.8 /100 | #60 | Exceptional 1.7% |
| Tsimshian | 99.8 /100 | #61 | Exceptional 1.7% |
| Immigrants | Northern Europe | 99.8 /100 | #62 | Exceptional 1.7% |
| Russians | 99.8 /100 | #63 | Exceptional 1.7% |
| New Zealanders | 99.7 /100 | #64 | Exceptional 1.7% |
| Serbians | 99.7 /100 | #65 | Exceptional 1.7% |
| Canadians | 99.7 /100 | #66 | Exceptional 1.7% |
| Immigrants | Austria | 99.7 /100 | #67 | Exceptional 1.7% |
| Immigrants | Lithuania | 99.7 /100 | #68 | Exceptional 1.7% |
| Chickasaw | 99.6 /100 | #69 | Exceptional 1.7% |
| Immigrants | Netherlands | 99.6 /100 | #70 | Exceptional 1.7% |
| Immigrants | England | 99.5 /100 | #71 | Exceptional 1.7% |