Ethiopian vs Belizean No Schooling Completed
COMPARE
Ethiopian
Belizean
No Schooling Completed
No Schooling Completed Comparison
Ethiopians
Belizeans
2.4%
NO SCHOOLING COMPLETED
0.8/ 100
METRIC RATING
255th/ 347
METRIC RANK
3.0%
NO SCHOOLING COMPLETED
0.0/ 100
METRIC RATING
306th/ 347
METRIC RANK
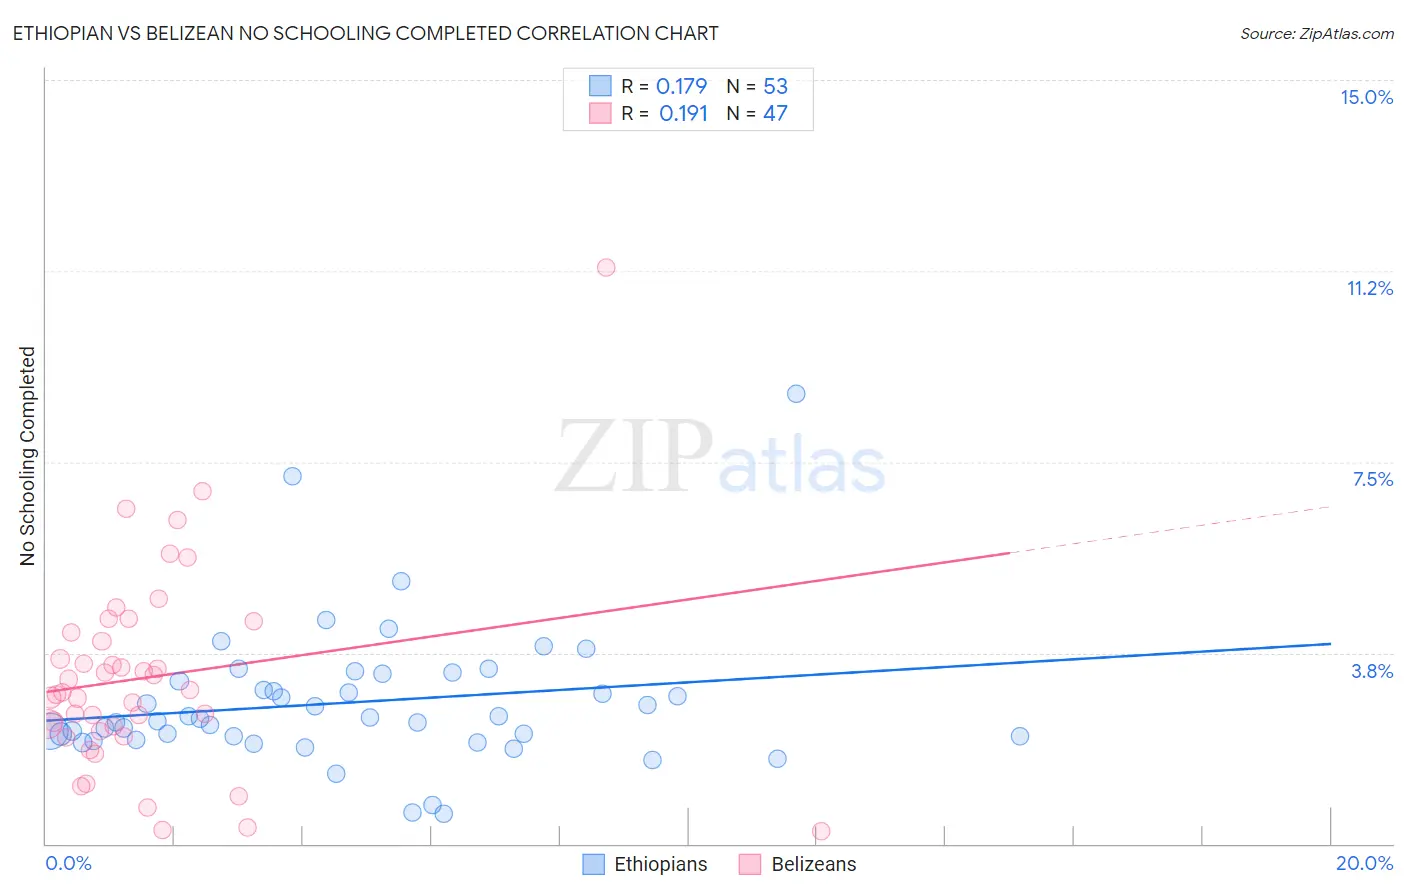
Ethiopian vs Belizean No Schooling Completed Correlation Chart
The statistical analysis conducted on geographies consisting of 222,131,269 people shows a poor positive correlation between the proportion of Ethiopians and percentage of population with no schooling in the United States with a correlation coefficient (R) of 0.179 and weighted average of 2.4%. Similarly, the statistical analysis conducted on geographies consisting of 143,887,803 people shows a poor positive correlation between the proportion of Belizeans and percentage of population with no schooling in the United States with a correlation coefficient (R) of 0.191 and weighted average of 3.0%, a difference of 23.8%.
No Schooling Completed Correlation Summary
| Measurement | Ethiopian | Belizean |
| Minimum | 0.59% | 0.25% |
| Maximum | 8.8% | 11.3% |
| Range | 8.3% | 11.1% |
| Mean | 2.8% | 3.3% |
| Median | 2.4% | 3.0% |
| Interquartile 25% (IQ1) | 2.1% | 2.2% |
| Interquartile 75% (IQ3) | 3.3% | 4.2% |
| Interquartile Range (IQR) | 1.2% | 1.9% |
| Standard Deviation (Sample) | 1.4% | 2.0% |
| Standard Deviation (Population) | 1.4% | 2.0% |
Similar Demographics by No Schooling Completed
Demographics Similar to Ethiopians by No Schooling Completed
In terms of no schooling completed, the demographic groups most similar to Ethiopians are Yaqui (2.4%, a difference of 0.17%), Immigrants from Eastern Africa (2.4%, a difference of 0.20%), Immigrants from Asia (2.4%, a difference of 0.33%), Immigrants from Colombia (2.4%, a difference of 0.45%), and Immigrants from Africa (2.4%, a difference of 0.90%).
| Demographics | Rating | Rank | No Schooling Completed |
| Asians | 1.2 /100 | #248 | Tragic 2.4% |
| Jamaicans | 1.2 /100 | #249 | Tragic 2.4% |
| Immigrants | Middle Africa | 1.1 /100 | #250 | Tragic 2.4% |
| Immigrants | Africa | 1.1 /100 | #251 | Tragic 2.4% |
| Immigrants | Colombia | 1.0 /100 | #252 | Tragic 2.4% |
| Immigrants | Asia | 0.9 /100 | #253 | Tragic 2.4% |
| Immigrants | Eastern Africa | 0.9 /100 | #254 | Tragic 2.4% |
| Ethiopians | 0.8 /100 | #255 | Tragic 2.4% |
| Yaqui | 0.8 /100 | #256 | Tragic 2.4% |
| Immigrants | South America | 0.6 /100 | #257 | Tragic 2.5% |
| Assyrians/Chaldeans/Syriacs | 0.6 /100 | #258 | Tragic 2.5% |
| Immigrants | Jamaica | 0.6 /100 | #259 | Tragic 2.5% |
| Immigrants | Ethiopia | 0.6 /100 | #260 | Tragic 2.5% |
| Armenians | 0.5 /100 | #261 | Tragic 2.5% |
| Immigrants | Sierra Leone | 0.5 /100 | #262 | Tragic 2.5% |
Demographics Similar to Belizeans by No Schooling Completed
In terms of no schooling completed, the demographic groups most similar to Belizeans are Immigrants from Haiti (3.0%, a difference of 0.080%), Immigrants from Somalia (3.0%, a difference of 0.24%), Hispanic or Latino (3.0%, a difference of 1.1%), Guyanese (3.0%, a difference of 1.1%), and Immigrants from the Azores (3.0%, a difference of 1.2%).
| Demographics | Rating | Rank | No Schooling Completed |
| Central American Indians | 0.0 /100 | #299 | Tragic 2.8% |
| Haitians | 0.0 /100 | #300 | Tragic 2.9% |
| Immigrants | South Eastern Asia | 0.0 /100 | #301 | Tragic 2.9% |
| Immigrants | Caribbean | 0.0 /100 | #302 | Tragic 2.9% |
| Somalis | 0.0 /100 | #303 | Tragic 2.9% |
| Nicaraguans | 0.0 /100 | #304 | Tragic 2.9% |
| Ecuadorians | 0.0 /100 | #305 | Tragic 3.0% |
| Belizeans | 0.0 /100 | #306 | Tragic 3.0% |
| Immigrants | Haiti | 0.0 /100 | #307 | Tragic 3.0% |
| Immigrants | Somalia | 0.0 /100 | #308 | Tragic 3.0% |
| Hispanics or Latinos | 0.0 /100 | #309 | Tragic 3.0% |
| Guyanese | 0.0 /100 | #310 | Tragic 3.0% |
| Immigrants | Azores | 0.0 /100 | #311 | Tragic 3.0% |
| Sri Lankans | 0.0 /100 | #312 | Tragic 3.0% |
| Hondurans | 0.0 /100 | #313 | Tragic 3.1% |