Ethiopian vs Welsh No Schooling Completed
COMPARE
Ethiopian
Welsh
No Schooling Completed
No Schooling Completed Comparison
Ethiopians
Welsh
2.4%
NO SCHOOLING COMPLETED
0.8/ 100
METRIC RATING
255th/ 347
METRIC RANK
1.5%
NO SCHOOLING COMPLETED
100.0/ 100
METRIC RATING
20th/ 347
METRIC RANK
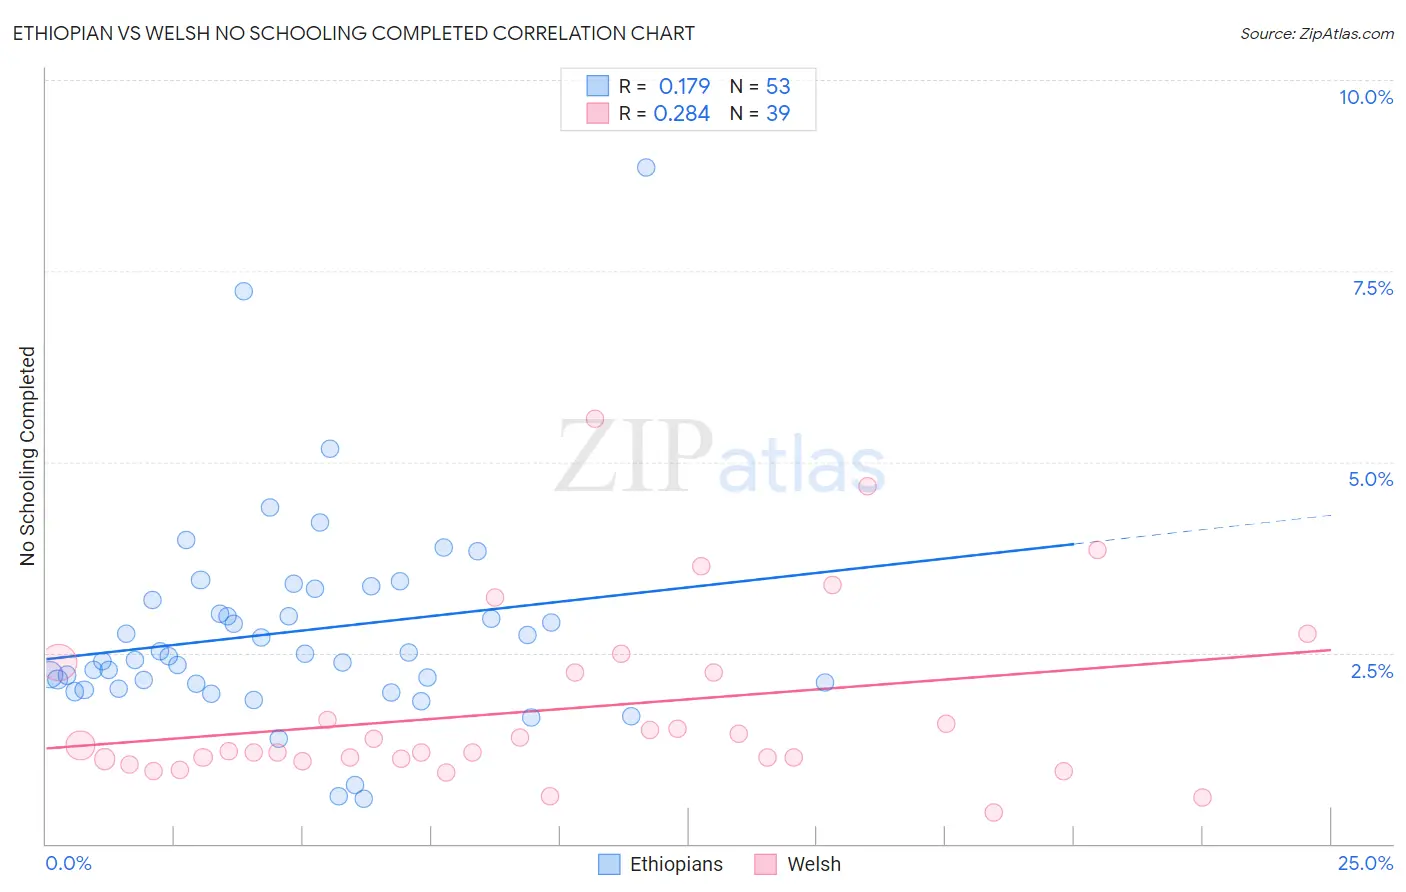
Ethiopian vs Welsh No Schooling Completed Correlation Chart
The statistical analysis conducted on geographies consisting of 222,131,269 people shows a poor positive correlation between the proportion of Ethiopians and percentage of population with no schooling in the United States with a correlation coefficient (R) of 0.179 and weighted average of 2.4%. Similarly, the statistical analysis conducted on geographies consisting of 514,712,087 people shows a weak positive correlation between the proportion of Welsh and percentage of population with no schooling in the United States with a correlation coefficient (R) of 0.284 and weighted average of 1.5%, a difference of 65.3%.
No Schooling Completed Correlation Summary
| Measurement | Ethiopian | Welsh |
| Minimum | 0.59% | 0.40% |
| Maximum | 8.8% | 5.6% |
| Range | 8.3% | 5.2% |
| Mean | 2.8% | 1.8% |
| Median | 2.4% | 1.2% |
| Interquartile 25% (IQ1) | 2.1% | 1.1% |
| Interquartile 75% (IQ3) | 3.3% | 2.2% |
| Interquartile Range (IQR) | 1.2% | 1.1% |
| Standard Deviation (Sample) | 1.4% | 1.2% |
| Standard Deviation (Population) | 1.4% | 1.1% |
Similar Demographics by No Schooling Completed
Demographics Similar to Ethiopians by No Schooling Completed
In terms of no schooling completed, the demographic groups most similar to Ethiopians are Yaqui (2.4%, a difference of 0.17%), Immigrants from Eastern Africa (2.4%, a difference of 0.20%), Immigrants from Asia (2.4%, a difference of 0.33%), Immigrants from Colombia (2.4%, a difference of 0.45%), and Immigrants from Africa (2.4%, a difference of 0.90%).
| Demographics | Rating | Rank | No Schooling Completed |
| Asians | 1.2 /100 | #248 | Tragic 2.4% |
| Jamaicans | 1.2 /100 | #249 | Tragic 2.4% |
| Immigrants | Middle Africa | 1.1 /100 | #250 | Tragic 2.4% |
| Immigrants | Africa | 1.1 /100 | #251 | Tragic 2.4% |
| Immigrants | Colombia | 1.0 /100 | #252 | Tragic 2.4% |
| Immigrants | Asia | 0.9 /100 | #253 | Tragic 2.4% |
| Immigrants | Eastern Africa | 0.9 /100 | #254 | Tragic 2.4% |
| Ethiopians | 0.8 /100 | #255 | Tragic 2.4% |
| Yaqui | 0.8 /100 | #256 | Tragic 2.4% |
| Immigrants | South America | 0.6 /100 | #257 | Tragic 2.5% |
| Assyrians/Chaldeans/Syriacs | 0.6 /100 | #258 | Tragic 2.5% |
| Immigrants | Jamaica | 0.6 /100 | #259 | Tragic 2.5% |
| Immigrants | Ethiopia | 0.6 /100 | #260 | Tragic 2.5% |
| Armenians | 0.5 /100 | #261 | Tragic 2.5% |
| Immigrants | Sierra Leone | 0.5 /100 | #262 | Tragic 2.5% |
Demographics Similar to Welsh by No Schooling Completed
In terms of no schooling completed, the demographic groups most similar to Welsh are Alaskan Athabascan (1.5%, a difference of 0.13%), Danish (1.5%, a difference of 0.23%), Chinese (1.5%, a difference of 0.37%), Alaska Native (1.5%, a difference of 0.46%), and Croatian (1.5%, a difference of 0.53%).
| Demographics | Rating | Rank | No Schooling Completed |
| Poles | 100.0 /100 | #13 | Exceptional 1.4% |
| Scotch-Irish | 100.0 /100 | #14 | Exceptional 1.5% |
| Tlingit-Haida | 100.0 /100 | #15 | Exceptional 1.5% |
| Finns | 100.0 /100 | #16 | Exceptional 1.5% |
| Croatians | 100.0 /100 | #17 | Exceptional 1.5% |
| Danes | 100.0 /100 | #18 | Exceptional 1.5% |
| Alaskan Athabascans | 100.0 /100 | #19 | Exceptional 1.5% |
| Welsh | 100.0 /100 | #20 | Exceptional 1.5% |
| Chinese | 100.0 /100 | #21 | Exceptional 1.5% |
| Alaska Natives | 100.0 /100 | #22 | Exceptional 1.5% |
| Europeans | 100.0 /100 | #23 | Exceptional 1.5% |
| Pennsylvania Germans | 100.0 /100 | #24 | Exceptional 1.5% |
| French | 100.0 /100 | #25 | Exceptional 1.5% |
| Czechs | 100.0 /100 | #26 | Exceptional 1.5% |
| Scandinavians | 100.0 /100 | #27 | Exceptional 1.5% |