Ethiopian vs Immigrants from El Salvador No Schooling Completed
COMPARE
Ethiopian
Immigrants from El Salvador
No Schooling Completed
No Schooling Completed Comparison
Ethiopians
Immigrants from El Salvador
2.4%
NO SCHOOLING COMPLETED
0.8/ 100
METRIC RATING
255th/ 347
METRIC RANK
3.9%
NO SCHOOLING COMPLETED
0.0/ 100
METRIC RATING
345th/ 347
METRIC RANK
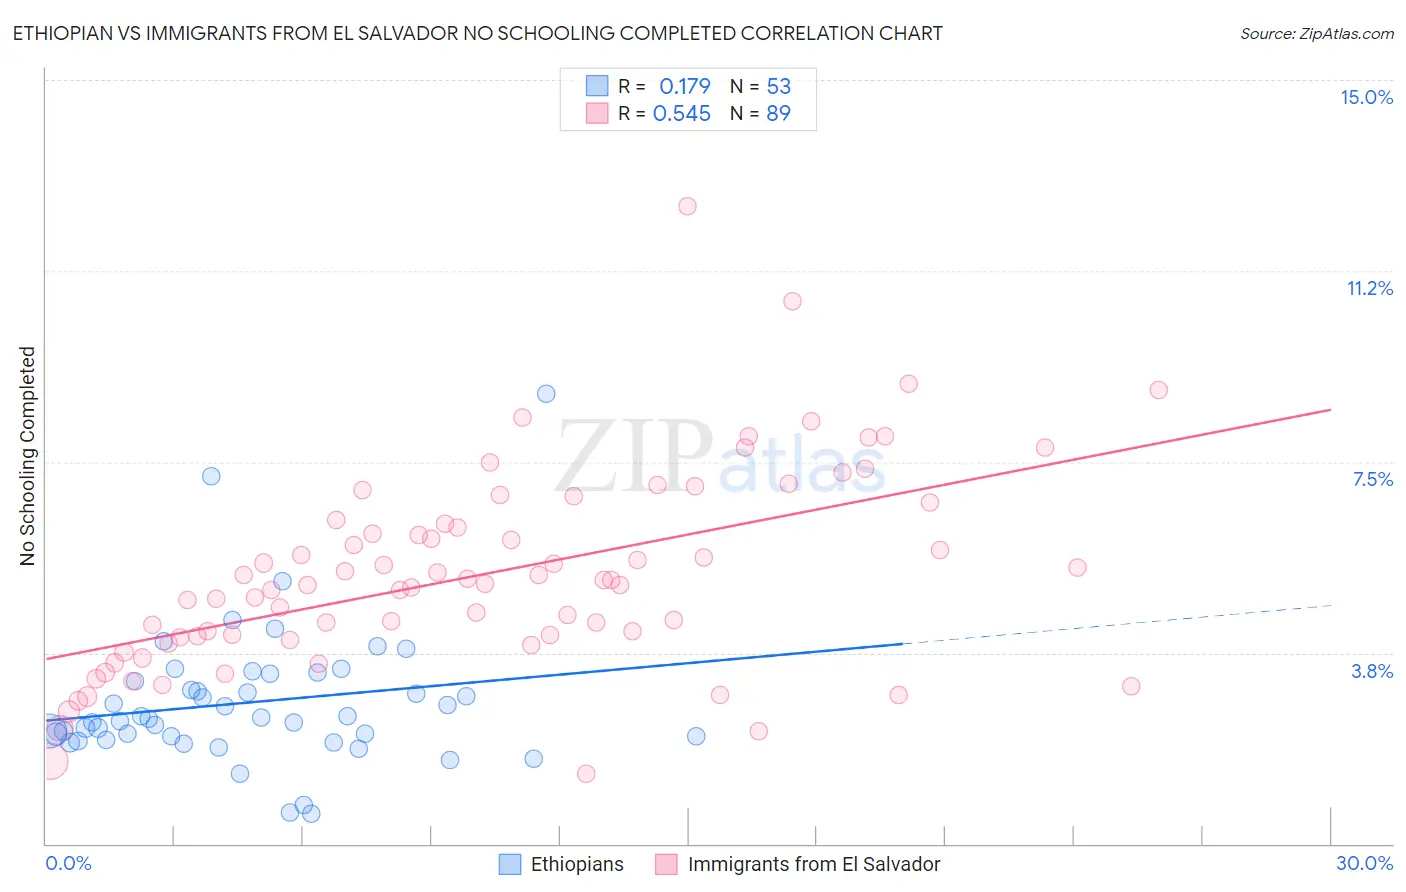
Ethiopian vs Immigrants from El Salvador No Schooling Completed Correlation Chart
The statistical analysis conducted on geographies consisting of 222,131,269 people shows a poor positive correlation between the proportion of Ethiopians and percentage of population with no schooling in the United States with a correlation coefficient (R) of 0.179 and weighted average of 2.4%. Similarly, the statistical analysis conducted on geographies consisting of 355,993,592 people shows a substantial positive correlation between the proportion of Immigrants from El Salvador and percentage of population with no schooling in the United States with a correlation coefficient (R) of 0.545 and weighted average of 3.9%, a difference of 59.8%.
No Schooling Completed Correlation Summary
| Measurement | Ethiopian | Immigrants from El Salvador |
| Minimum | 0.59% | 1.4% |
| Maximum | 8.8% | 12.5% |
| Range | 8.3% | 11.1% |
| Mean | 2.8% | 5.3% |
| Median | 2.4% | 5.1% |
| Interquartile 25% (IQ1) | 2.1% | 4.0% |
| Interquartile 75% (IQ3) | 3.3% | 6.3% |
| Interquartile Range (IQR) | 1.2% | 2.3% |
| Standard Deviation (Sample) | 1.4% | 1.9% |
| Standard Deviation (Population) | 1.4% | 1.9% |
Similar Demographics by No Schooling Completed
Demographics Similar to Ethiopians by No Schooling Completed
In terms of no schooling completed, the demographic groups most similar to Ethiopians are Yaqui (2.4%, a difference of 0.17%), Immigrants from Eastern Africa (2.4%, a difference of 0.20%), Immigrants from Asia (2.4%, a difference of 0.33%), Immigrants from Colombia (2.4%, a difference of 0.45%), and Immigrants from Africa (2.4%, a difference of 0.90%).
| Demographics | Rating | Rank | No Schooling Completed |
| Asians | 1.2 /100 | #248 | Tragic 2.4% |
| Jamaicans | 1.2 /100 | #249 | Tragic 2.4% |
| Immigrants | Middle Africa | 1.1 /100 | #250 | Tragic 2.4% |
| Immigrants | Africa | 1.1 /100 | #251 | Tragic 2.4% |
| Immigrants | Colombia | 1.0 /100 | #252 | Tragic 2.4% |
| Immigrants | Asia | 0.9 /100 | #253 | Tragic 2.4% |
| Immigrants | Eastern Africa | 0.9 /100 | #254 | Tragic 2.4% |
| Ethiopians | 0.8 /100 | #255 | Tragic 2.4% |
| Yaqui | 0.8 /100 | #256 | Tragic 2.4% |
| Immigrants | South America | 0.6 /100 | #257 | Tragic 2.5% |
| Assyrians/Chaldeans/Syriacs | 0.6 /100 | #258 | Tragic 2.5% |
| Immigrants | Jamaica | 0.6 /100 | #259 | Tragic 2.5% |
| Immigrants | Ethiopia | 0.6 /100 | #260 | Tragic 2.5% |
| Armenians | 0.5 /100 | #261 | Tragic 2.5% |
| Immigrants | Sierra Leone | 0.5 /100 | #262 | Tragic 2.5% |
Demographics Similar to Immigrants from El Salvador by No Schooling Completed
In terms of no schooling completed, the demographic groups most similar to Immigrants from El Salvador are Nepalese (3.8%, a difference of 1.8%), Salvadoran (3.7%, a difference of 3.5%), Immigrants from Mexico (3.6%, a difference of 6.4%), Immigrants from Yemen (4.1%, a difference of 6.4%), and Immigrants from Central America (3.6%, a difference of 7.3%).
| Demographics | Rating | Rank | No Schooling Completed |
| Immigrants | Dominican Republic | 0.0 /100 | #333 | Tragic 3.4% |
| Guatemalans | 0.0 /100 | #334 | Tragic 3.5% |
| Immigrants | Cambodia | 0.0 /100 | #335 | Tragic 3.5% |
| Immigrants | Fiji | 0.0 /100 | #336 | Tragic 3.5% |
| Immigrants | Cabo Verde | 0.0 /100 | #337 | Tragic 3.5% |
| Bangladeshis | 0.0 /100 | #338 | Tragic 3.5% |
| Yakama | 0.0 /100 | #339 | Tragic 3.6% |
| Immigrants | Guatemala | 0.0 /100 | #340 | Tragic 3.6% |
| Immigrants | Central America | 0.0 /100 | #341 | Tragic 3.6% |
| Immigrants | Mexico | 0.0 /100 | #342 | Tragic 3.6% |
| Salvadorans | 0.0 /100 | #343 | Tragic 3.7% |
| Nepalese | 0.0 /100 | #344 | Tragic 3.8% |
| Immigrants | El Salvador | 0.0 /100 | #345 | Tragic 3.9% |
| Immigrants | Yemen | 0.0 /100 | #346 | Tragic 4.1% |
| Spanish American Indians | 0.0 /100 | #347 | Tragic 4.2% |