Nepalese vs New Zealander No Schooling Completed
COMPARE
Nepalese
New Zealander
No Schooling Completed
No Schooling Completed Comparison
Nepalese
New Zealanders
3.8%
NO SCHOOLING COMPLETED
0.0/ 100
METRIC RATING
344th/ 347
METRIC RANK
1.7%
NO SCHOOLING COMPLETED
99.7/ 100
METRIC RATING
64th/ 347
METRIC RANK
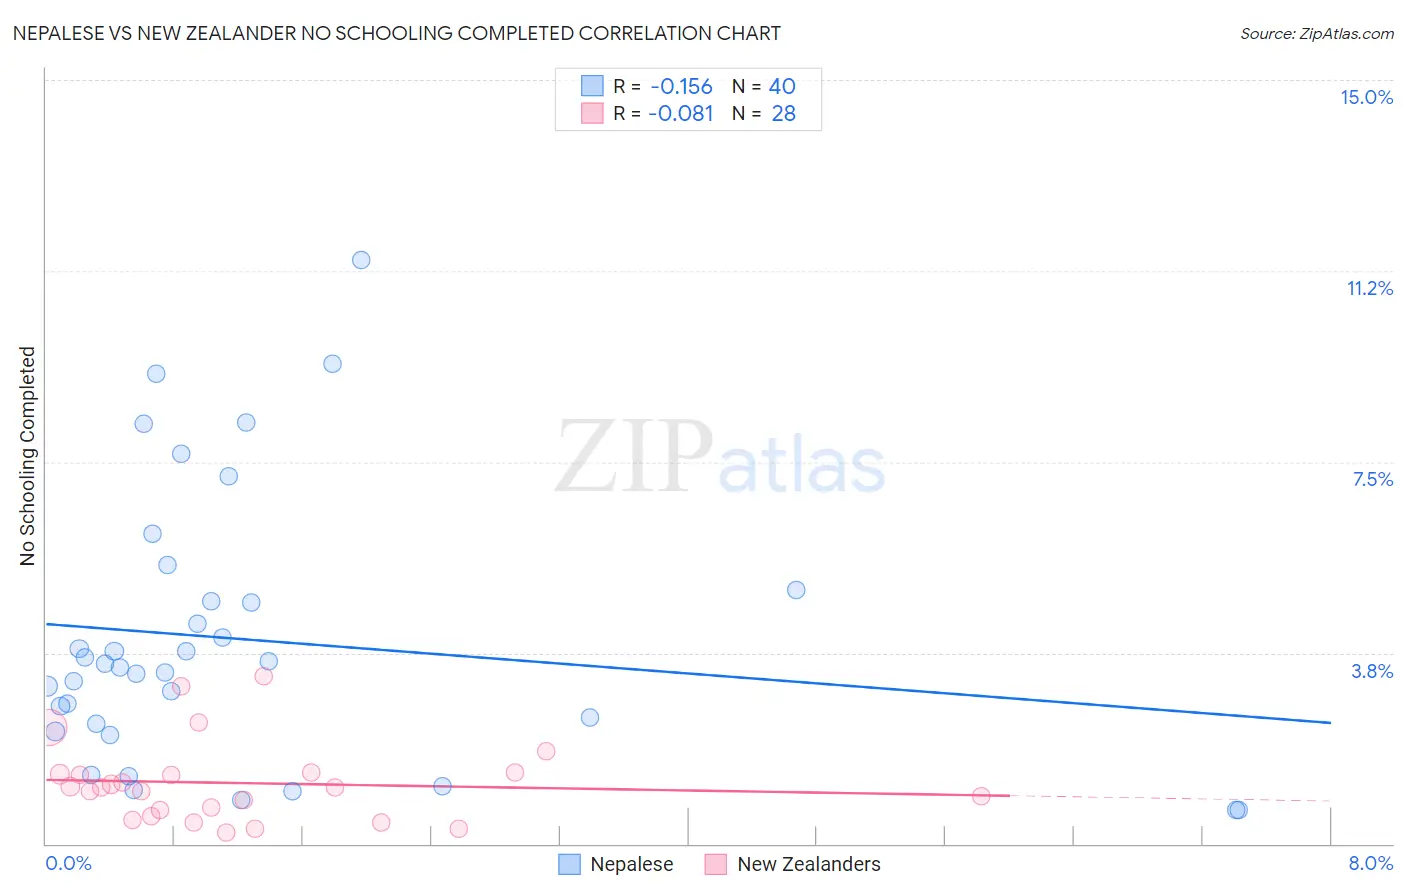
Nepalese vs New Zealander No Schooling Completed Correlation Chart
The statistical analysis conducted on geographies consisting of 24,510,165 people shows a poor negative correlation between the proportion of Nepalese and percentage of population with no schooling in the United States with a correlation coefficient (R) of -0.156 and weighted average of 3.8%. Similarly, the statistical analysis conducted on geographies consisting of 106,449,248 people shows a slight negative correlation between the proportion of New Zealanders and percentage of population with no schooling in the United States with a correlation coefficient (R) of -0.081 and weighted average of 1.7%, a difference of 127.8%.
No Schooling Completed Correlation Summary
| Measurement | Nepalese | New Zealander |
| Minimum | 0.66% | 0.23% |
| Maximum | 11.5% | 3.3% |
| Range | 10.8% | 3.1% |
| Mean | 4.0% | 1.2% |
| Median | 3.5% | 1.1% |
| Interquartile 25% (IQ1) | 2.3% | 0.60% |
| Interquartile 75% (IQ3) | 4.9% | 1.4% |
| Interquartile Range (IQR) | 2.6% | 0.78% |
| Standard Deviation (Sample) | 2.6% | 0.78% |
| Standard Deviation (Population) | 2.6% | 0.77% |
Similar Demographics by No Schooling Completed
Demographics Similar to Nepalese by No Schooling Completed
In terms of no schooling completed, the demographic groups most similar to Nepalese are Salvadoran (3.7%, a difference of 1.7%), Immigrants from El Salvador (3.9%, a difference of 1.8%), Immigrants from Mexico (3.6%, a difference of 4.5%), Immigrants from Central America (3.6%, a difference of 5.3%), and Immigrants from Guatemala (3.6%, a difference of 6.4%).
| Demographics | Rating | Rank | No Schooling Completed |
| Immigrants | Dominican Republic | 0.0 /100 | #333 | Tragic 3.4% |
| Guatemalans | 0.0 /100 | #334 | Tragic 3.5% |
| Immigrants | Cambodia | 0.0 /100 | #335 | Tragic 3.5% |
| Immigrants | Fiji | 0.0 /100 | #336 | Tragic 3.5% |
| Immigrants | Cabo Verde | 0.0 /100 | #337 | Tragic 3.5% |
| Bangladeshis | 0.0 /100 | #338 | Tragic 3.5% |
| Yakama | 0.0 /100 | #339 | Tragic 3.6% |
| Immigrants | Guatemala | 0.0 /100 | #340 | Tragic 3.6% |
| Immigrants | Central America | 0.0 /100 | #341 | Tragic 3.6% |
| Immigrants | Mexico | 0.0 /100 | #342 | Tragic 3.6% |
| Salvadorans | 0.0 /100 | #343 | Tragic 3.7% |
| Nepalese | 0.0 /100 | #344 | Tragic 3.8% |
| Immigrants | El Salvador | 0.0 /100 | #345 | Tragic 3.9% |
| Immigrants | Yemen | 0.0 /100 | #346 | Tragic 4.1% |
| Spanish American Indians | 0.0 /100 | #347 | Tragic 4.2% |
Demographics Similar to New Zealanders by No Schooling Completed
In terms of no schooling completed, the demographic groups most similar to New Zealanders are Serbian (1.7%, a difference of 0.040%), Russian (1.7%, a difference of 0.16%), Canadian (1.7%, a difference of 0.18%), Immigrants from Northern Europe (1.7%, a difference of 0.20%), and Immigrants from Austria (1.7%, a difference of 0.37%).
| Demographics | Rating | Rank | No Schooling Completed |
| Austrians | 99.8 /100 | #57 | Exceptional 1.6% |
| Kiowa | 99.8 /100 | #58 | Exceptional 1.6% |
| Slavs | 99.8 /100 | #59 | Exceptional 1.7% |
| Americans | 99.8 /100 | #60 | Exceptional 1.7% |
| Tsimshian | 99.8 /100 | #61 | Exceptional 1.7% |
| Immigrants | Northern Europe | 99.8 /100 | #62 | Exceptional 1.7% |
| Russians | 99.8 /100 | #63 | Exceptional 1.7% |
| New Zealanders | 99.7 /100 | #64 | Exceptional 1.7% |
| Serbians | 99.7 /100 | #65 | Exceptional 1.7% |
| Canadians | 99.7 /100 | #66 | Exceptional 1.7% |
| Immigrants | Austria | 99.7 /100 | #67 | Exceptional 1.7% |
| Immigrants | Lithuania | 99.7 /100 | #68 | Exceptional 1.7% |
| Chickasaw | 99.6 /100 | #69 | Exceptional 1.7% |
| Immigrants | Netherlands | 99.6 /100 | #70 | Exceptional 1.7% |
| Immigrants | England | 99.5 /100 | #71 | Exceptional 1.7% |