Immigrants from Singapore vs Immigrants from El Salvador No Schooling Completed
COMPARE
Immigrants from Singapore
Immigrants from El Salvador
No Schooling Completed
No Schooling Completed Comparison
Immigrants from Singapore
Immigrants from El Salvador
1.8%
NO SCHOOLING COMPLETED
98.0/ 100
METRIC RATING
100th/ 347
METRIC RANK
3.9%
NO SCHOOLING COMPLETED
0.0/ 100
METRIC RATING
345th/ 347
METRIC RANK
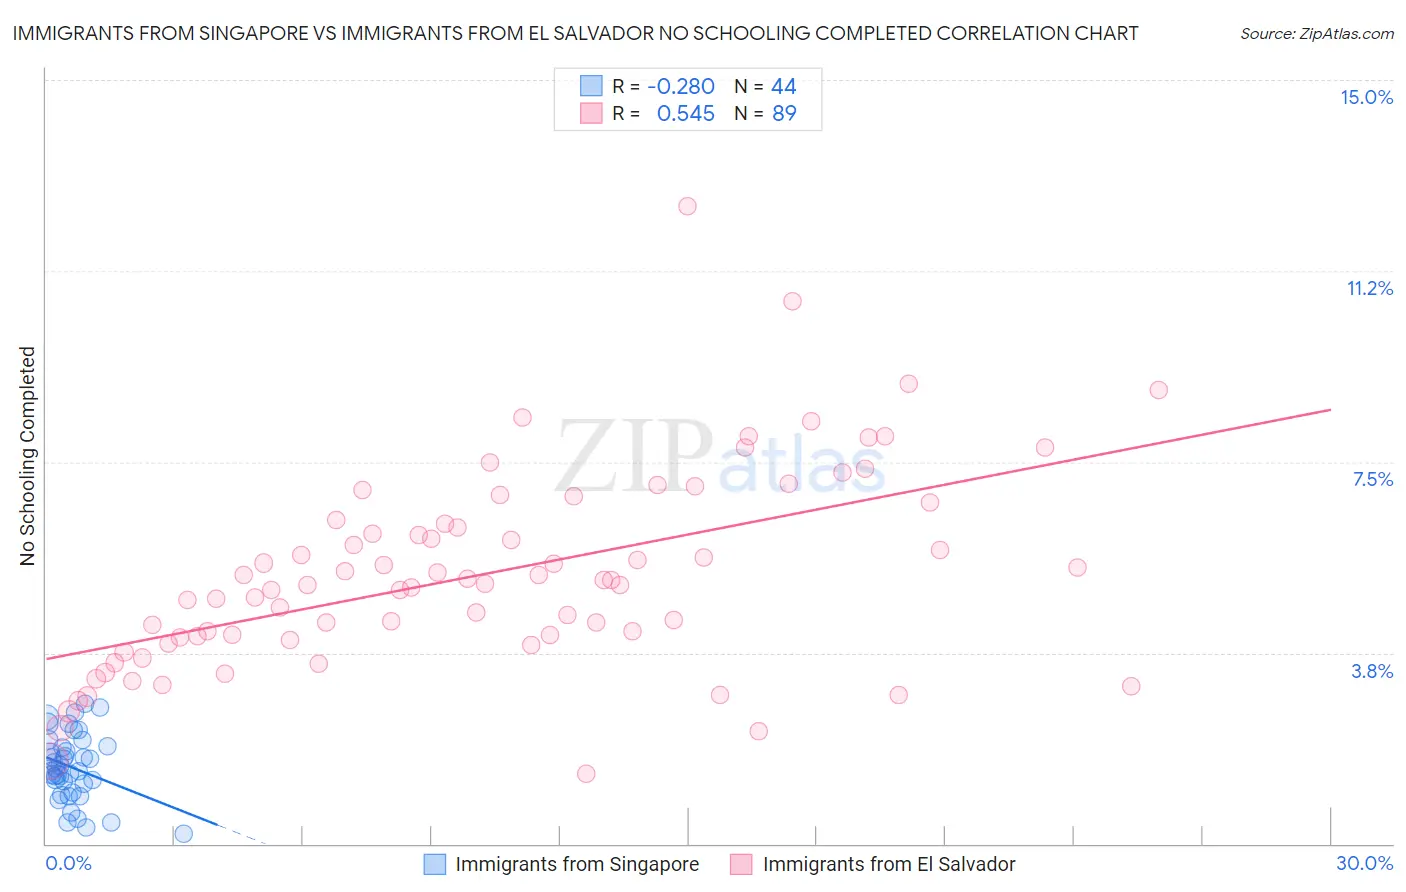
Immigrants from Singapore vs Immigrants from El Salvador No Schooling Completed Correlation Chart
The statistical analysis conducted on geographies consisting of 136,992,443 people shows a weak negative correlation between the proportion of Immigrants from Singapore and percentage of population with no schooling in the United States with a correlation coefficient (R) of -0.280 and weighted average of 1.8%. Similarly, the statistical analysis conducted on geographies consisting of 355,993,592 people shows a substantial positive correlation between the proportion of Immigrants from El Salvador and percentage of population with no schooling in the United States with a correlation coefficient (R) of 0.545 and weighted average of 3.9%, a difference of 113.5%.
No Schooling Completed Correlation Summary
| Measurement | Immigrants from Singapore | Immigrants from El Salvador |
| Minimum | 0.21% | 1.4% |
| Maximum | 2.8% | 12.5% |
| Range | 2.6% | 11.1% |
| Mean | 1.5% | 5.3% |
| Median | 1.5% | 5.1% |
| Interquartile 25% (IQ1) | 1.1% | 4.0% |
| Interquartile 75% (IQ3) | 1.9% | 6.3% |
| Interquartile Range (IQR) | 0.82% | 2.3% |
| Standard Deviation (Sample) | 0.65% | 1.9% |
| Standard Deviation (Population) | 0.64% | 1.9% |
Similar Demographics by No Schooling Completed
Demographics Similar to Immigrants from Singapore by No Schooling Completed
In terms of no schooling completed, the demographic groups most similar to Immigrants from Singapore are Choctaw (1.8%, a difference of 0.20%), Immigrants from Czechoslovakia (1.8%, a difference of 0.30%), Immigrants from Switzerland (1.8%, a difference of 0.30%), Basque (1.8%, a difference of 0.35%), and Iranian (1.8%, a difference of 0.39%).
| Demographics | Rating | Rank | No Schooling Completed |
| Turks | 98.7 /100 | #93 | Exceptional 1.8% |
| Immigrants | Nonimmigrants | 98.5 /100 | #94 | Exceptional 1.8% |
| Puget Sound Salish | 98.5 /100 | #95 | Exceptional 1.8% |
| Bhutanese | 98.4 /100 | #96 | Exceptional 1.8% |
| Immigrants | Ireland | 98.4 /100 | #97 | Exceptional 1.8% |
| Iranians | 98.2 /100 | #98 | Exceptional 1.8% |
| Choctaw | 98.1 /100 | #99 | Exceptional 1.8% |
| Immigrants | Singapore | 98.0 /100 | #100 | Exceptional 1.8% |
| Immigrants | Czechoslovakia | 97.9 /100 | #101 | Exceptional 1.8% |
| Immigrants | Switzerland | 97.9 /100 | #102 | Exceptional 1.8% |
| Basques | 97.9 /100 | #103 | Exceptional 1.8% |
| Thais | 97.5 /100 | #104 | Exceptional 1.8% |
| German Russians | 97.5 /100 | #105 | Exceptional 1.8% |
| Immigrants | France | 97.3 /100 | #106 | Exceptional 1.8% |
| Yugoslavians | 97.2 /100 | #107 | Exceptional 1.8% |
Demographics Similar to Immigrants from El Salvador by No Schooling Completed
In terms of no schooling completed, the demographic groups most similar to Immigrants from El Salvador are Nepalese (3.8%, a difference of 1.8%), Salvadoran (3.7%, a difference of 3.5%), Immigrants from Mexico (3.6%, a difference of 6.4%), Immigrants from Yemen (4.1%, a difference of 6.4%), and Immigrants from Central America (3.6%, a difference of 7.3%).
| Demographics | Rating | Rank | No Schooling Completed |
| Immigrants | Dominican Republic | 0.0 /100 | #333 | Tragic 3.4% |
| Guatemalans | 0.0 /100 | #334 | Tragic 3.5% |
| Immigrants | Cambodia | 0.0 /100 | #335 | Tragic 3.5% |
| Immigrants | Fiji | 0.0 /100 | #336 | Tragic 3.5% |
| Immigrants | Cabo Verde | 0.0 /100 | #337 | Tragic 3.5% |
| Bangladeshis | 0.0 /100 | #338 | Tragic 3.5% |
| Yakama | 0.0 /100 | #339 | Tragic 3.6% |
| Immigrants | Guatemala | 0.0 /100 | #340 | Tragic 3.6% |
| Immigrants | Central America | 0.0 /100 | #341 | Tragic 3.6% |
| Immigrants | Mexico | 0.0 /100 | #342 | Tragic 3.6% |
| Salvadorans | 0.0 /100 | #343 | Tragic 3.7% |
| Nepalese | 0.0 /100 | #344 | Tragic 3.8% |
| Immigrants | El Salvador | 0.0 /100 | #345 | Tragic 3.9% |
| Immigrants | Yemen | 0.0 /100 | #346 | Tragic 4.1% |
| Spanish American Indians | 0.0 /100 | #347 | Tragic 4.2% |