Paiute vs Immigrants from El Salvador No Schooling Completed
COMPARE
Paiute
Immigrants from El Salvador
No Schooling Completed
No Schooling Completed Comparison
Paiute
Immigrants from El Salvador
2.4%
NO SCHOOLING COMPLETED
1.9/ 100
METRIC RATING
238th/ 347
METRIC RANK
3.9%
NO SCHOOLING COMPLETED
0.0/ 100
METRIC RATING
345th/ 347
METRIC RANK
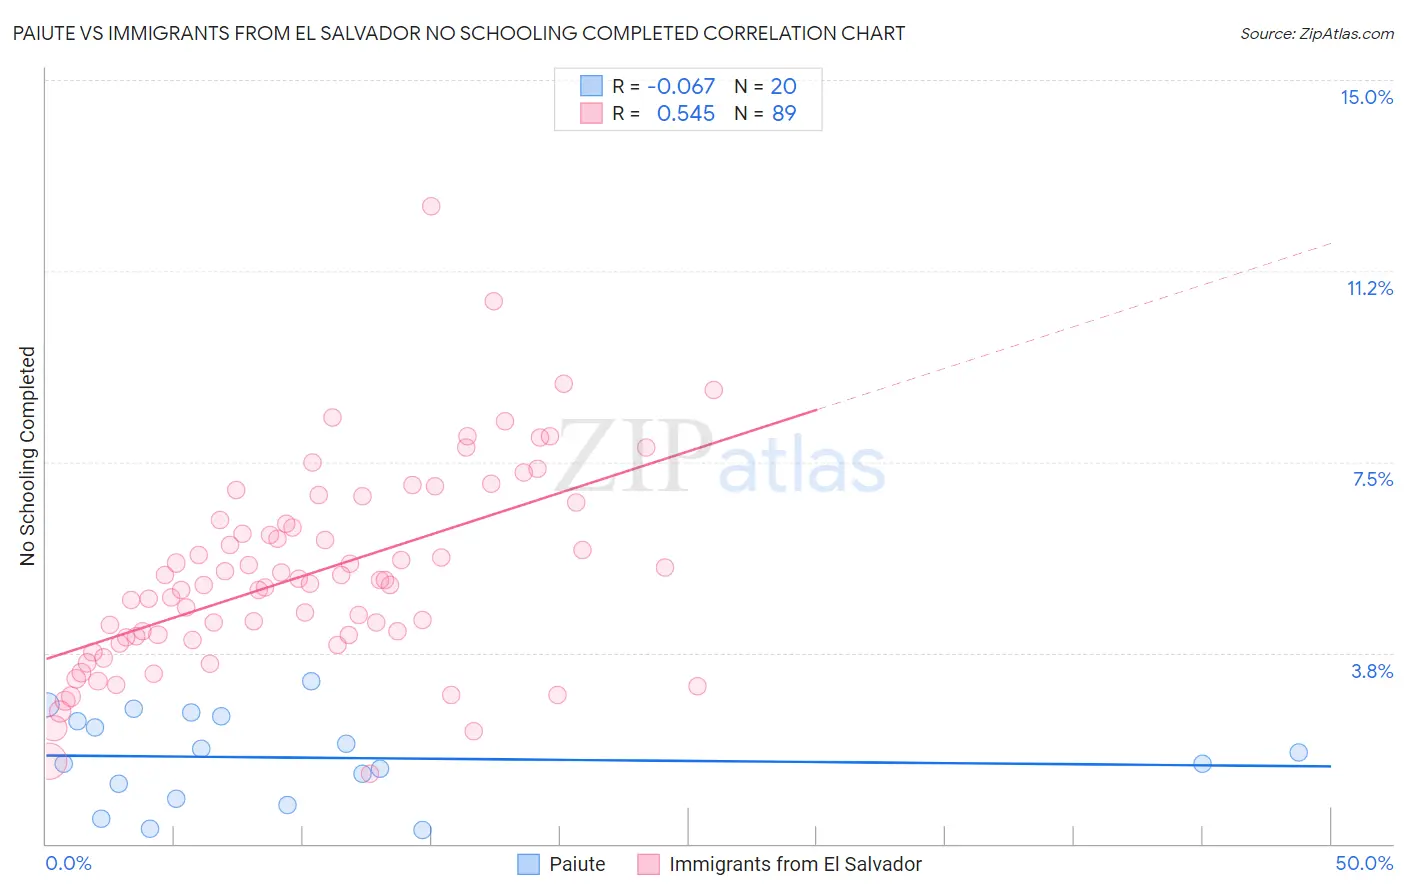
Paiute vs Immigrants from El Salvador No Schooling Completed Correlation Chart
The statistical analysis conducted on geographies consisting of 58,130,923 people shows a slight negative correlation between the proportion of Paiute and percentage of population with no schooling in the United States with a correlation coefficient (R) of -0.067 and weighted average of 2.4%. Similarly, the statistical analysis conducted on geographies consisting of 355,993,592 people shows a substantial positive correlation between the proportion of Immigrants from El Salvador and percentage of population with no schooling in the United States with a correlation coefficient (R) of 0.545 and weighted average of 3.9%, a difference of 63.7%.
No Schooling Completed Correlation Summary
| Measurement | Paiute | Immigrants from El Salvador |
| Minimum | 0.28% | 1.4% |
| Maximum | 3.2% | 12.5% |
| Range | 2.9% | 11.1% |
| Mean | 1.7% | 5.3% |
| Median | 1.7% | 5.1% |
| Interquartile 25% (IQ1) | 1.0% | 4.0% |
| Interquartile 75% (IQ3) | 2.5% | 6.3% |
| Interquartile Range (IQR) | 1.4% | 2.3% |
| Standard Deviation (Sample) | 0.86% | 1.9% |
| Standard Deviation (Population) | 0.84% | 1.9% |
Similar Demographics by No Schooling Completed
Demographics Similar to Paiute by No Schooling Completed
In terms of no schooling completed, the demographic groups most similar to Paiute are Liberian (2.4%, a difference of 0.12%), Immigrants from Eastern Asia (2.4%, a difference of 0.21%), Immigrants from Senegal (2.4%, a difference of 0.35%), Iraqi (2.4%, a difference of 0.41%), and Korean (2.4%, a difference of 0.41%).
| Demographics | Rating | Rank | No Schooling Completed |
| Immigrants | Uruguay | 3.4 /100 | #231 | Tragic 2.3% |
| Colombians | 3.2 /100 | #232 | Tragic 2.3% |
| Immigrants | Malaysia | 2.8 /100 | #233 | Tragic 2.3% |
| Nigerians | 2.6 /100 | #234 | Tragic 2.3% |
| Immigrants | Western Asia | 2.6 /100 | #235 | Tragic 2.3% |
| Iraqis | 2.2 /100 | #236 | Tragic 2.4% |
| Immigrants | Eastern Asia | 2.0 /100 | #237 | Tragic 2.4% |
| Paiute | 1.9 /100 | #238 | Tragic 2.4% |
| Liberians | 1.8 /100 | #239 | Tragic 2.4% |
| Immigrants | Senegal | 1.7 /100 | #240 | Tragic 2.4% |
| Koreans | 1.7 /100 | #241 | Tragic 2.4% |
| Immigrants | Indonesia | 1.5 /100 | #242 | Tragic 2.4% |
| South Americans | 1.5 /100 | #243 | Tragic 2.4% |
| Peruvians | 1.4 /100 | #244 | Tragic 2.4% |
| Bolivians | 1.4 /100 | #245 | Tragic 2.4% |
Demographics Similar to Immigrants from El Salvador by No Schooling Completed
In terms of no schooling completed, the demographic groups most similar to Immigrants from El Salvador are Nepalese (3.8%, a difference of 1.8%), Salvadoran (3.7%, a difference of 3.5%), Immigrants from Mexico (3.6%, a difference of 6.4%), Immigrants from Yemen (4.1%, a difference of 6.4%), and Immigrants from Central America (3.6%, a difference of 7.3%).
| Demographics | Rating | Rank | No Schooling Completed |
| Immigrants | Dominican Republic | 0.0 /100 | #333 | Tragic 3.4% |
| Guatemalans | 0.0 /100 | #334 | Tragic 3.5% |
| Immigrants | Cambodia | 0.0 /100 | #335 | Tragic 3.5% |
| Immigrants | Fiji | 0.0 /100 | #336 | Tragic 3.5% |
| Immigrants | Cabo Verde | 0.0 /100 | #337 | Tragic 3.5% |
| Bangladeshis | 0.0 /100 | #338 | Tragic 3.5% |
| Yakama | 0.0 /100 | #339 | Tragic 3.6% |
| Immigrants | Guatemala | 0.0 /100 | #340 | Tragic 3.6% |
| Immigrants | Central America | 0.0 /100 | #341 | Tragic 3.6% |
| Immigrants | Mexico | 0.0 /100 | #342 | Tragic 3.6% |
| Salvadorans | 0.0 /100 | #343 | Tragic 3.7% |
| Nepalese | 0.0 /100 | #344 | Tragic 3.8% |
| Immigrants | El Salvador | 0.0 /100 | #345 | Tragic 3.9% |
| Immigrants | Yemen | 0.0 /100 | #346 | Tragic 4.1% |
| Spanish American Indians | 0.0 /100 | #347 | Tragic 4.2% |