French Canadian vs Immigrants from El Salvador No Schooling Completed
COMPARE
French Canadian
Immigrants from El Salvador
No Schooling Completed
No Schooling Completed Comparison
French Canadians
Immigrants from El Salvador
1.5%
NO SCHOOLING COMPLETED
100.0/ 100
METRIC RATING
28th/ 347
METRIC RANK
3.9%
NO SCHOOLING COMPLETED
0.0/ 100
METRIC RATING
345th/ 347
METRIC RANK
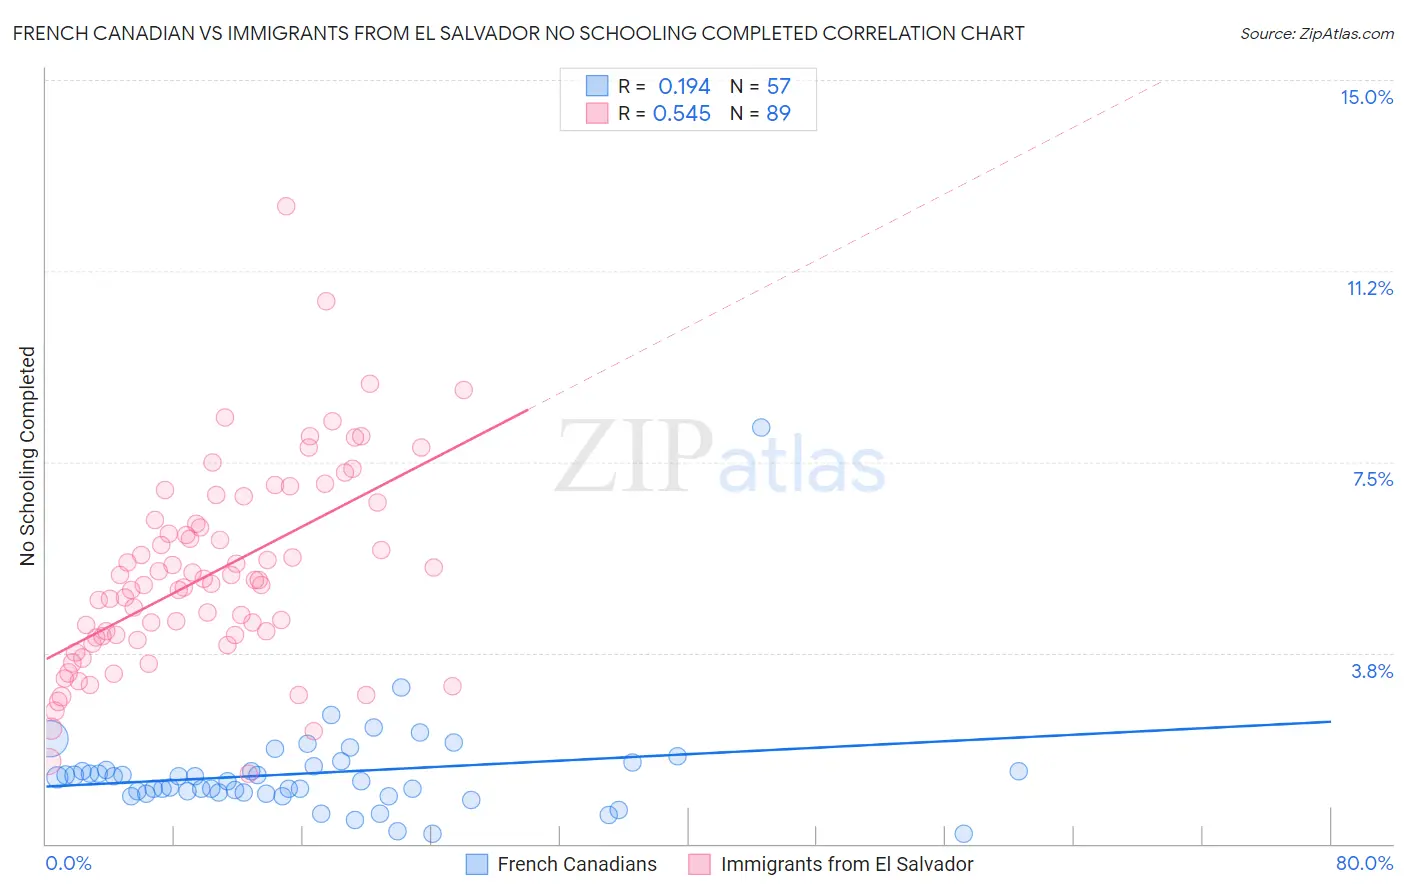
French Canadian vs Immigrants from El Salvador No Schooling Completed Correlation Chart
The statistical analysis conducted on geographies consisting of 491,496,199 people shows a poor positive correlation between the proportion of French Canadians and percentage of population with no schooling in the United States with a correlation coefficient (R) of 0.194 and weighted average of 1.5%. Similarly, the statistical analysis conducted on geographies consisting of 355,993,592 people shows a substantial positive correlation between the proportion of Immigrants from El Salvador and percentage of population with no schooling in the United States with a correlation coefficient (R) of 0.545 and weighted average of 3.9%, a difference of 158.4%.
No Schooling Completed Correlation Summary
| Measurement | French Canadian | Immigrants from El Salvador |
| Minimum | 0.20% | 1.4% |
| Maximum | 8.2% | 12.5% |
| Range | 8.0% | 11.1% |
| Mean | 1.4% | 5.3% |
| Median | 1.2% | 5.1% |
| Interquartile 25% (IQ1) | 0.99% | 4.0% |
| Interquartile 75% (IQ3) | 1.5% | 6.3% |
| Interquartile Range (IQR) | 0.49% | 2.3% |
| Standard Deviation (Sample) | 1.1% | 1.9% |
| Standard Deviation (Population) | 1.1% | 1.9% |
Similar Demographics by No Schooling Completed
Demographics Similar to French Canadians by No Schooling Completed
In terms of no schooling completed, the demographic groups most similar to French Canadians are Scandinavian (1.5%, a difference of 0.010%), Czech (1.5%, a difference of 0.54%), Lumbee (1.5%, a difference of 0.91%), French (1.5%, a difference of 1.1%), and Pennsylvania German (1.5%, a difference of 1.1%).
| Demographics | Rating | Rank | No Schooling Completed |
| Chinese | 100.0 /100 | #21 | Exceptional 1.5% |
| Alaska Natives | 100.0 /100 | #22 | Exceptional 1.5% |
| Europeans | 100.0 /100 | #23 | Exceptional 1.5% |
| Pennsylvania Germans | 100.0 /100 | #24 | Exceptional 1.5% |
| French | 100.0 /100 | #25 | Exceptional 1.5% |
| Czechs | 100.0 /100 | #26 | Exceptional 1.5% |
| Scandinavians | 100.0 /100 | #27 | Exceptional 1.5% |
| French Canadians | 100.0 /100 | #28 | Exceptional 1.5% |
| Lumbee | 100.0 /100 | #29 | Exceptional 1.5% |
| British | 100.0 /100 | #30 | Exceptional 1.5% |
| Inupiat | 100.0 /100 | #31 | Exceptional 1.5% |
| Swiss | 100.0 /100 | #32 | Exceptional 1.5% |
| Italians | 100.0 /100 | #33 | Exceptional 1.5% |
| Latvians | 100.0 /100 | #34 | Exceptional 1.5% |
| Eastern Europeans | 100.0 /100 | #35 | Exceptional 1.6% |
Demographics Similar to Immigrants from El Salvador by No Schooling Completed
In terms of no schooling completed, the demographic groups most similar to Immigrants from El Salvador are Nepalese (3.8%, a difference of 1.8%), Salvadoran (3.7%, a difference of 3.5%), Immigrants from Mexico (3.6%, a difference of 6.4%), Immigrants from Yemen (4.1%, a difference of 6.4%), and Immigrants from Central America (3.6%, a difference of 7.3%).
| Demographics | Rating | Rank | No Schooling Completed |
| Immigrants | Dominican Republic | 0.0 /100 | #333 | Tragic 3.4% |
| Guatemalans | 0.0 /100 | #334 | Tragic 3.5% |
| Immigrants | Cambodia | 0.0 /100 | #335 | Tragic 3.5% |
| Immigrants | Fiji | 0.0 /100 | #336 | Tragic 3.5% |
| Immigrants | Cabo Verde | 0.0 /100 | #337 | Tragic 3.5% |
| Bangladeshis | 0.0 /100 | #338 | Tragic 3.5% |
| Yakama | 0.0 /100 | #339 | Tragic 3.6% |
| Immigrants | Guatemala | 0.0 /100 | #340 | Tragic 3.6% |
| Immigrants | Central America | 0.0 /100 | #341 | Tragic 3.6% |
| Immigrants | Mexico | 0.0 /100 | #342 | Tragic 3.6% |
| Salvadorans | 0.0 /100 | #343 | Tragic 3.7% |
| Nepalese | 0.0 /100 | #344 | Tragic 3.8% |
| Immigrants | El Salvador | 0.0 /100 | #345 | Tragic 3.9% |
| Immigrants | Yemen | 0.0 /100 | #346 | Tragic 4.1% |
| Spanish American Indians | 0.0 /100 | #347 | Tragic 4.2% |